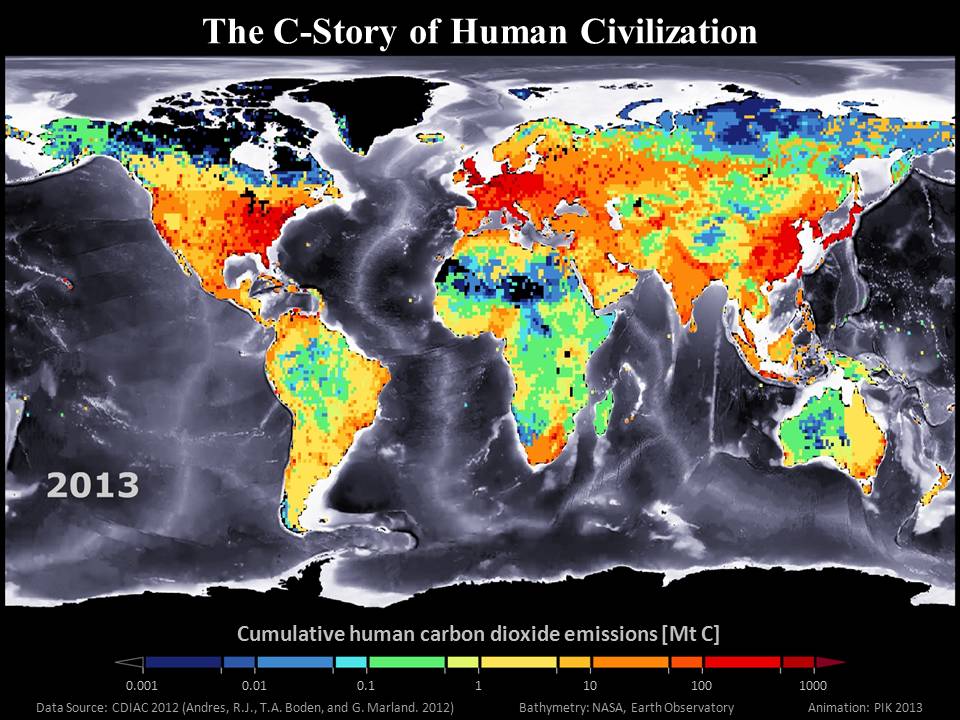

The C-Story of Human Civilization by PIK is licensed under a Creative Commons BY-NC 3.0 DE license.
The animation uses data from CDIAC (2016):
Andres, R.J., T.A. Boden, and G. Marland (2016). Annual Fossil-Fuel CO2 Emissions: Mass of Emissions Gridded by One Degree Latitude by One Degree Longitude. Carbon Dioxide Information Analysis Center, Oak Ridge National Laboratory, U.S. Department of Energy, Oak Ridge, Tenn., U.S.A.
DOI: 10.3334/CDIAC/ffe.ndp058.2016
and NASA earth image data:
NASA. Credit: Reto Stöckli. NASA Earth Observatory Blue Marble – Next Generation raw bathymetry data

The C-Story of Human Civilization by PIK is licensed under a Creative Commons BY-NC 3.0 DE license.
The animation uses data from CDIAC (2012):
Andres, R.J. T.A. Boden, and G. Marland (2012). Annual Fossil-Fuel CO2 Emissions: Mass of Emissions Gridded by One Degree Latitude by One Degree Longitude. Carbon Dioxide Information Analysis Center, Oak Ridge National Laboratory, U.S. Department of Energy, Oak Ridge, Tenn., U.S.A.
DOI: 10.3334/CDIAC/ffe.ndp058.2012
and NASA earth image data:
NASA. Credit: Reto Stöckli. NASA Earth Observatory Blue Marble – Next Generation raw bathymetry data


