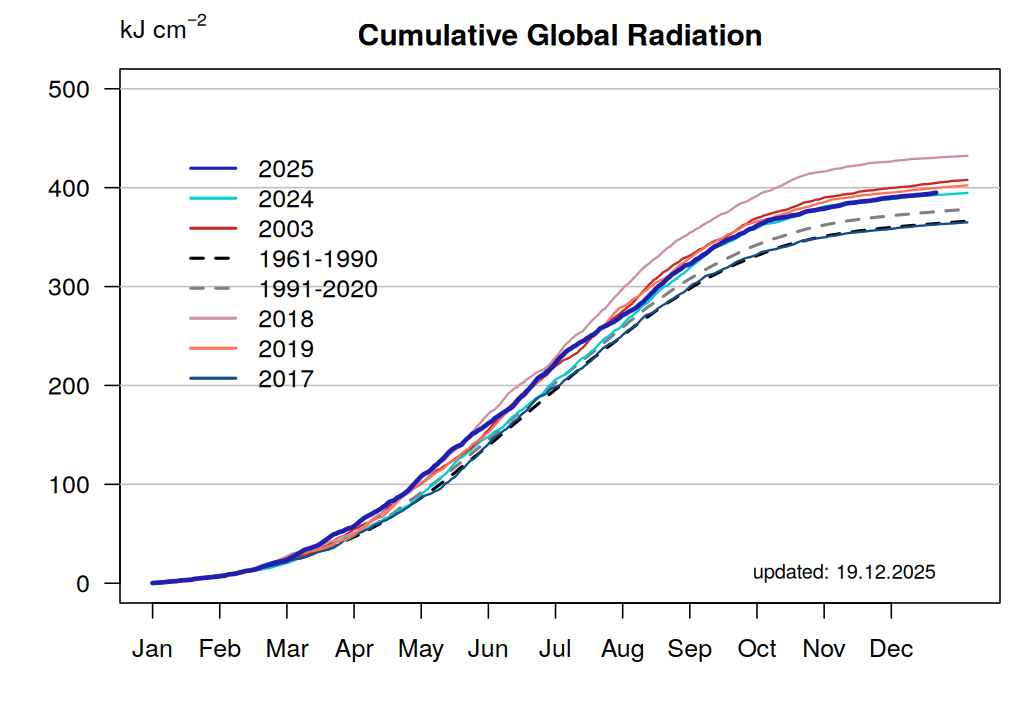
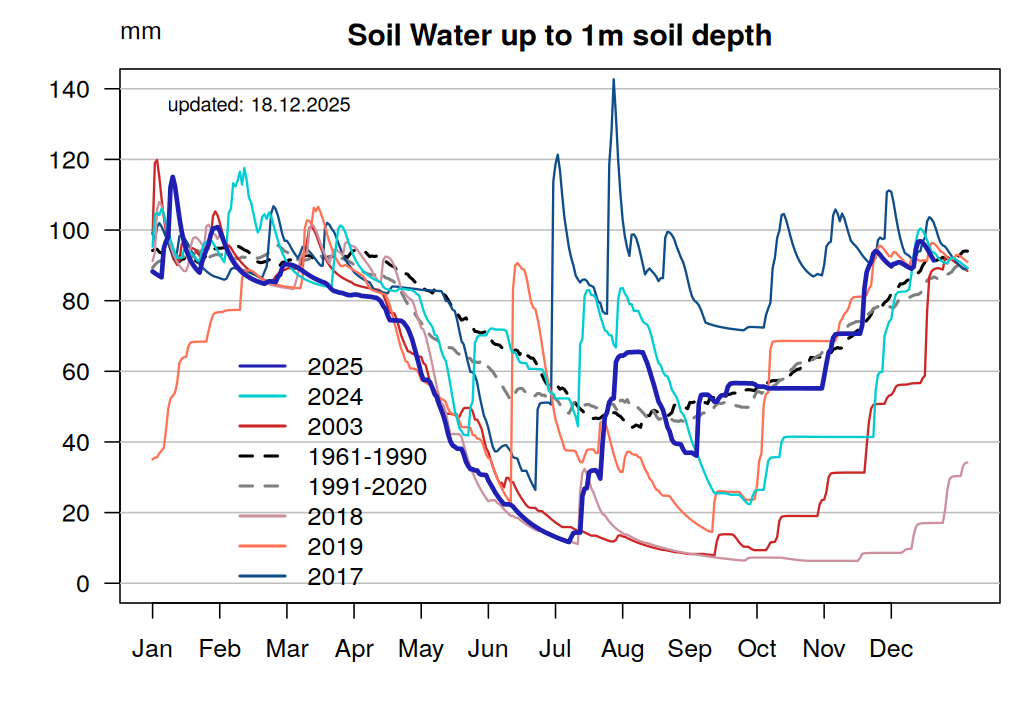
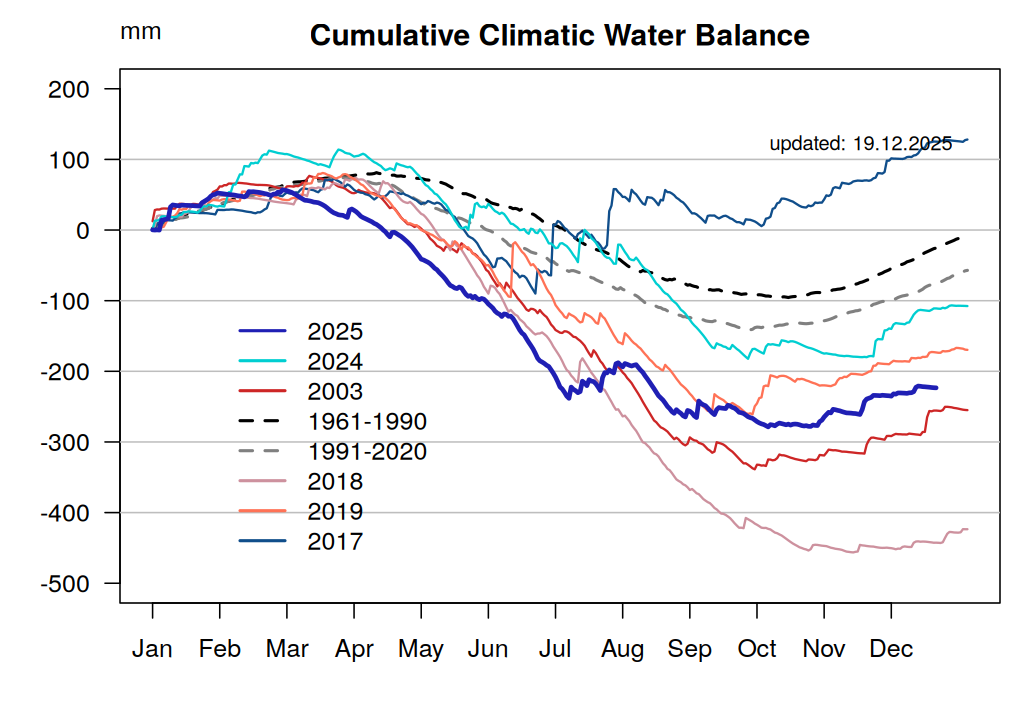
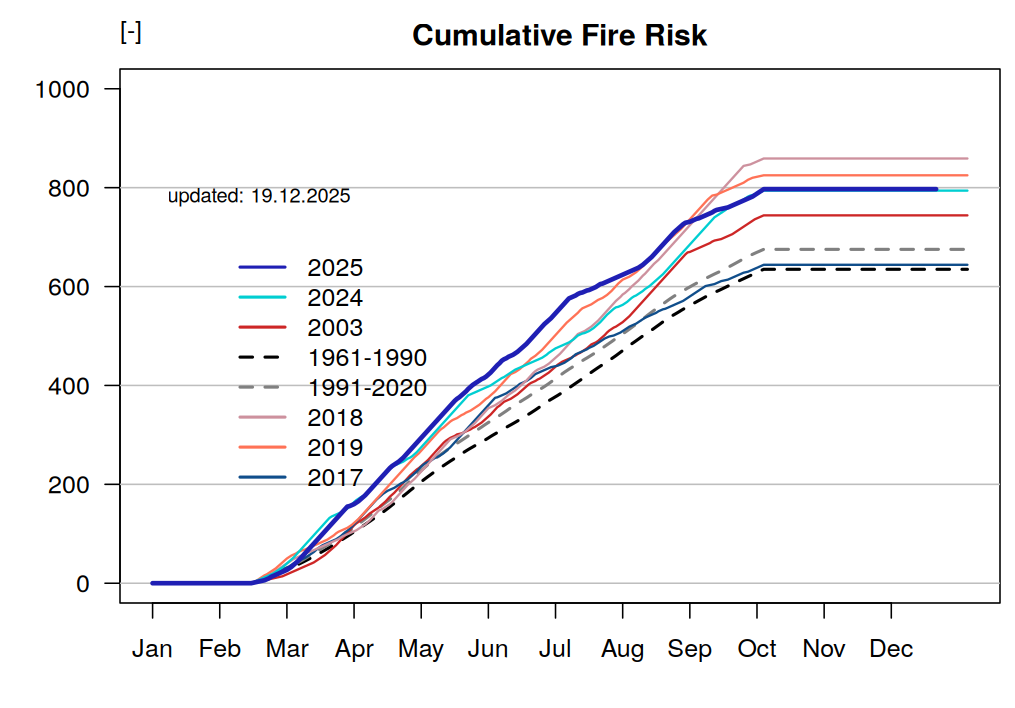
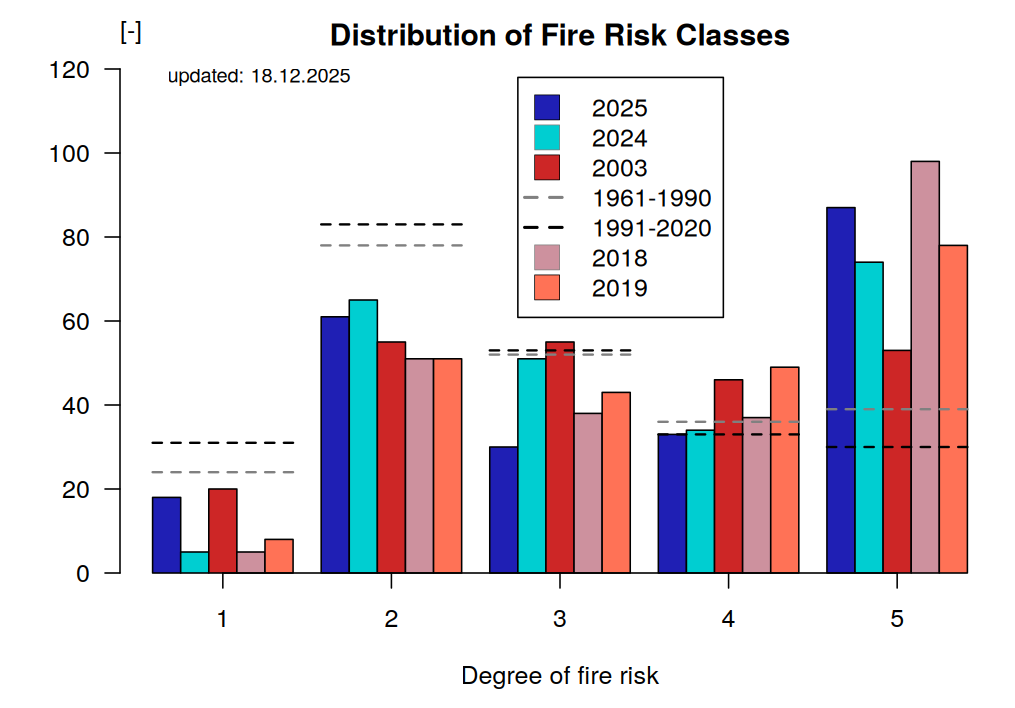
The parameters are measured by the long-term meteorological station Potsdam Telegraphenberg or simulated using these data by the forest growth model 4C. The model 4C delivers key parameters of the water and carbon budget of a 70-80 years old pine stand on a sandy soil (Cambisol) and a forest fire danger index.
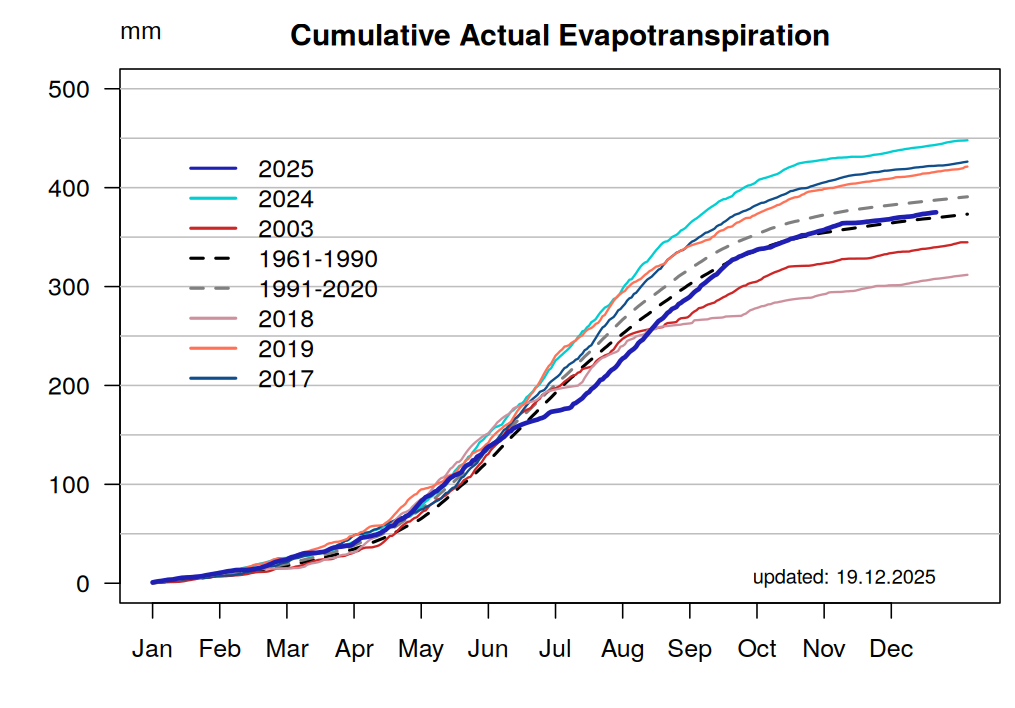
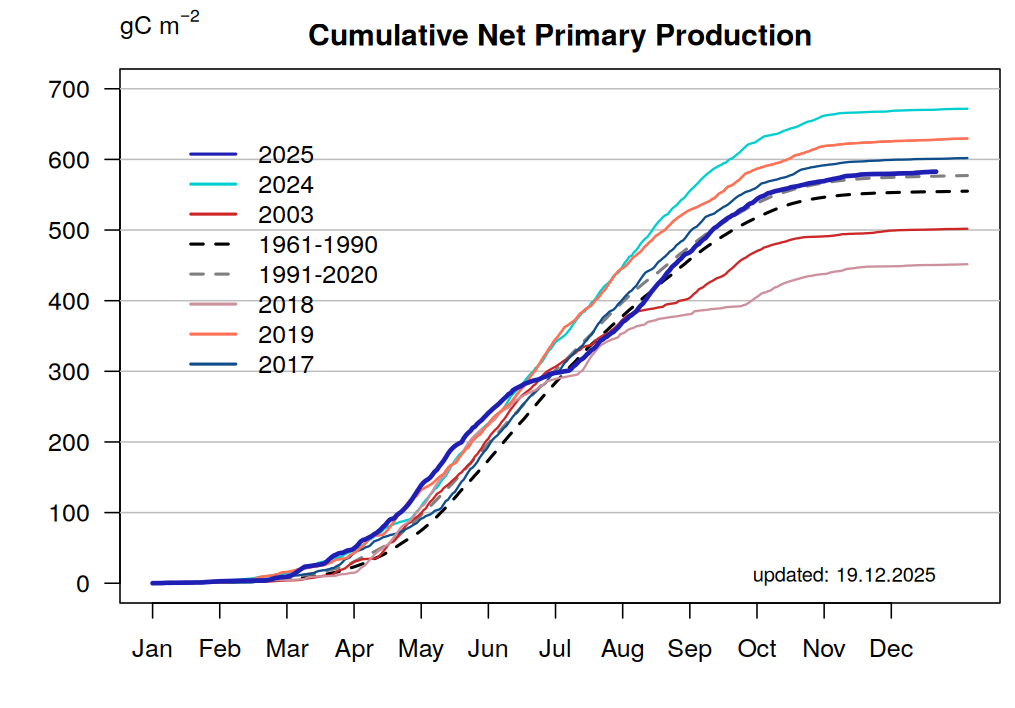
In addition to the 1961-1990 comparison period, we have plotted the 30-year average 1991-2020, which shows a warmer and thus drier trend in soil water, especially in early summer.
From 01.01.2020, the DWD series of measurements was converted to fully automatic recordings. The measured values are available approximately two days later, so that our images are never from the current day.
Weather analysis
based on the forest growth model 4C (Lasch-Born, P. et al. 2019) see https://gitlab.pik-potsdam.de/foresee/4C
Mean daily temperature - annual variability
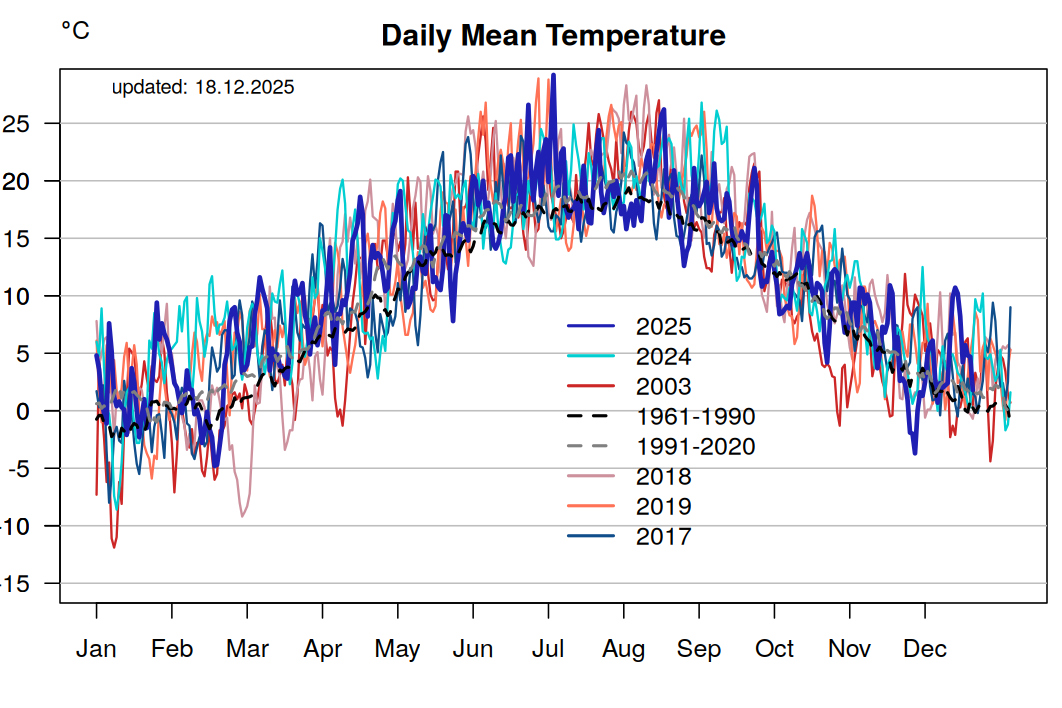
Mean daily temperature - cumulative annual variability
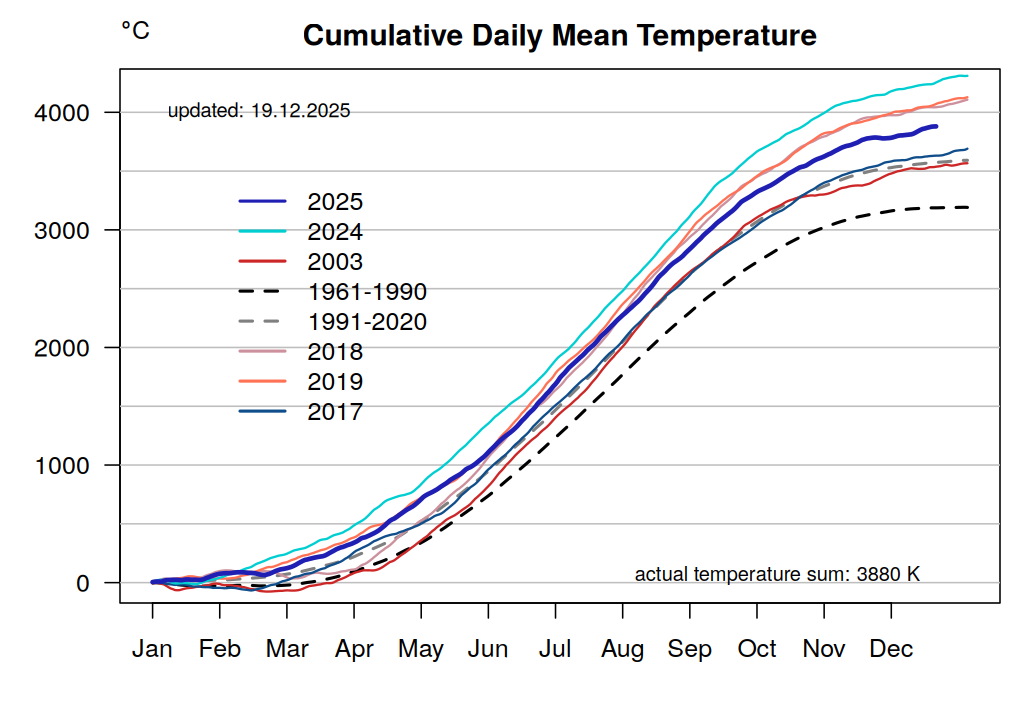
Precipitation - cumulative annual variability
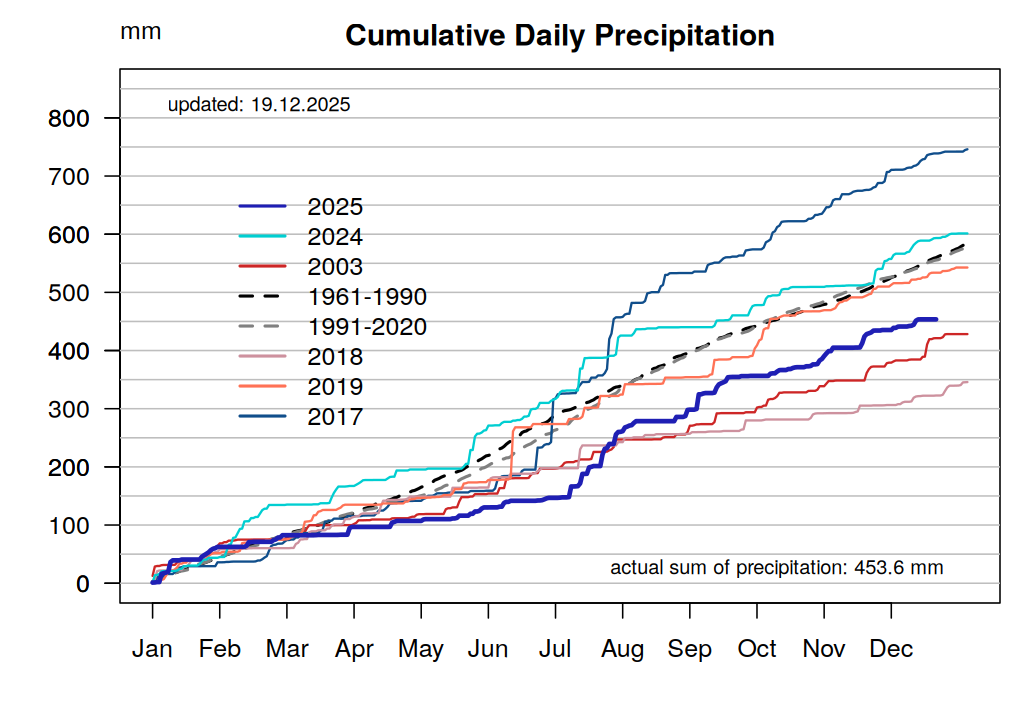
Soil water - annual variability
Water balance - cumulative annual variability
Fire risk index - cumulative annual variability
Fire risk index - frequency annual variability
Evapotraspiration - cumulative annual variability
Net primary production - cumulative annual variability
Global radiation - cumulative annual variability
