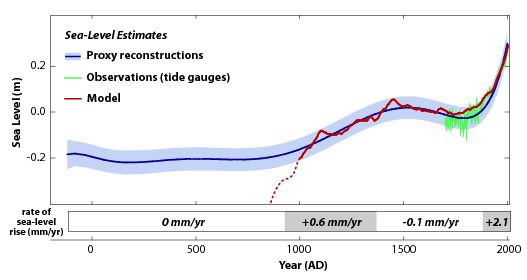
At least for the last one thousand years the ups and downs of global mean temperature can explain sea-level behaviour, says an international team of researchers in the Proceedings of the National Academy of Sciences. The new findings substantiate the assumption, based on physics, that the warmer global climate becomes, the faster sea level rises.
“The new study confirms our model of sea-level rise – looking at the past improves our view into the future”, says Stefan Rahmstorf of the Potsdam Institute for Climate Impact Research, one of the authors. Up to now the link between global mean surface temperature and sea level had been demonstrated just for the past 130 years, not 1000 years. The coinicidence of increasing sea-level rise and the beginning of industrialization is a clear sign, says Rahmstorf: “Humankind, by emitting greenhouse gases, keeps heating the climate more and more. Therefore land ice melts faster and sea level rises faster.”
“Sea-level rise is a potentially disastrous outcome of climate change, as rising temperatures melt land-based ice and warm ocean waters”, says Benjamin Horton of the University of Pennsylvania, another of the authors. When water heats it expands, and sea level rises. The second cause for sea-level rise is the melting of mountain glaciers and the ice sheets in Greenland and Antarctica, releasing more water into the sea.
The researchers analysed fossil shells of microorganisms they found in drilling cores from salt marshes along the US coast – this is a natural archive of sea-level rise. The species and numbers of these calcium carbonate shells indicate the sea level, since each level within the tidal range is characterized by a particular set of organisms that live there. The data from North Carolina is in good agreement with tide gauge data and has been confirmed by an independent reconstruction from Massachusetts. The records were also corrected for contributions to relative sea-level rise from vertical land movements. Even though regional sea-level variations can differ from the global mean, the researchers conclude that their findings represent the global sea-level evolution to within ± 10 centimetres.
The data shows four phases. Sea level was relatively stable from 200 B.C. to 1000 A.D. Starting in the 11th century, it rose for 400 years by around five centimetres per century. This can be explained by the medieval warm period. This was followed by a second period of stable sea level associated with a cooler climate. Since the late 19th century, however, along with global warming sea level has risen by about 20 centimetres. This is the steepest rate for more than 2000 years.
In addition to Rahmstorf and Horton, the research was conducted by Andrew Kemp of Yale University, Jeffrey Donnelly of the Woods Hole Oceanographic Institution, Michael Mann of Pennsylvania State University, and Martin Vermeer of Finland’s Aalto University School of Engineering. Support for this research was provided amongst others by the US National Science Foundation.

More Information
Comprehensive information on sea level rise can be found: http://www.pik-potsdam.de/sealevel/
Two key studies on the relation between global mean temperature and sea level rise can be found:
http://www.pik-potsdam.de/~stefan/Publications/Nature/rahmstorf_science_2007.pdf
http://www.pik-potsdam.de/~stefan/Publications/Journals/vermeer_rahmstorf_2009.pdf


