Time series have a natural temporal ordering that make it possible to document the systematic
development of observations. Detection studies (Box 3 2) use statistical techniques to
demonstrate how a variable has changed over time, however, no judgement is made about the
likely causes of change (Hegerl et al., 2007).
Box 3 2: Overview of Trend Detection
Question addressed
Is there a trend in observations?
Data requirements
Time-series data for the study unit.
Typical result
Statistically significant trend in the data.
Generic steps
1. Select variables of interest
2. Apply statistical methods
|
At its simplest, trend detection is the process of applying a statistical model to timeseries
data in order to establish the form and the strength of changes over a given period.
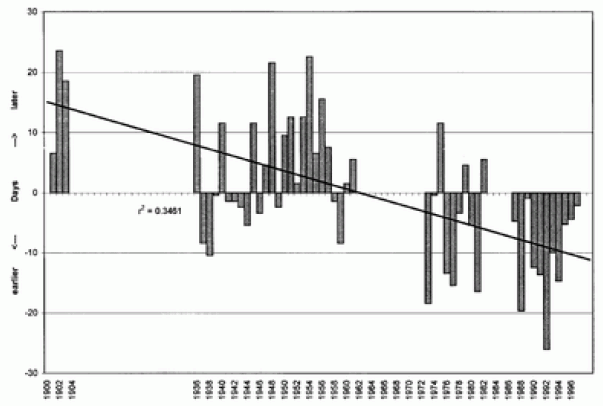
This technique can be illustrated using a graph depicting flowering dates for Aspen in
Canada from 1901-1997, which appear to have been occurring earlier in recent decades. To
demonstrate this, the authors have fitted a linear trend to the data for the entire period, which
shows a coefficient of determination (r2) of 0.35. However, the data set is incomplete, with
notable gaps in the time series. Here it is advisable to plot trends for sub-periods as well,
and the authors note that the same trend (0.26 days per year) is seen in the well-reported
years 1973-1997. Once such a trend is detected, its likely causes can be investigated through
impacts attribution.

Figure 3-1: First-flowering dates of Aspen (Populus tremuloides) at Edmonton, Alberta plotted as deviations in days from the long-term mean date bars relative to the mean bloom date (bars). A linear trend has been fitted to the data for 1901-1997. Source: Beaubien and Freeland (2000).
Trend detection can be applied to data associated with either natural or human
systems. For example, Emanuel (2005) studied the destructiveness of tropical storms between
1949 and 2003 by using measures derived from systematic observations of cyclone activity
over five ocean basins. He found an upward trend in the strength of tropical cyclones after
the mid-1970s, especially over the western North Pacific and North Atlantic Oceans. On the
other hand, Pielke Jr. et al. (2008) analyzed the destructiveness of tropical storms in terms of
economic factors. They analyzed damages associated with US mainland hurricane landfalls
from 1900 to 2005, normalizing the data to account for changing societal conditions over the
time series. Their results indicated an absence of any long-term trend in economic damages
over the study period.

