You are here: Home / Case studies / EU3 - Forest fires
case: EU3 location: Europe sectors: Forestry

Question

Which question has been addressed in this step?

Exploring risk: What is the impact of climate change on forest fire risk (probability x burned area) in Europe under different adaptation options?

Case step navigator: click any node to select the respective step

Why has this question been chosen?

  • Because adaptive capacity w.r.t. forest fires is still very unclear. The impacts on social and economic values are not clear and the economic resources to respond to increasing fires are not well known.
    Society will need to adapt to many of the impacts.
  • Adaptation is important because fire suppression is one of the key factors controlling the human induced fires probability and it is possible to include fire detection/response as parameter of the model. Fast detection/response time might lead to smaller burned area in particular under dry conditions.
  • Improved knowledge on the effects of prevention is also important i.e. to have a look at zones with high fuel load, and effects of its reduction.

Which methods have been applied?

  • CLM Fires runs to 2100 using as forcing climate scenarios of the ENSEMBLES FP7 Project (Scenario A1B).in order to compute future scenarios of fire probability and burned area.
  • CLM Fire has fuel loads among its parameters. Prescribed burning statistics are necessary to reflect the fuel load change as the consequence of that preventive measure.
  • Simplified stand-alone forest fires model (SSFM) driven by the amount of fuel and moisture calculated with CLMFires.
  • Two adaptation options considered: (1) prevention: prescribed burnings - by explicitly reducing available above ground biomass in CLM-Fire and (2) active response: better fire suppression modeled through modification of fire suppression parameters in CLM-Fire and SSFM.
  • Run SSFM for different levels of fuel loads representing prescribed burning; secondly, modifying the model parameters related to fire prevention (e.g. thinning and prescribed burning) and to fire suppression (e.g. detection/response time).
  • Combine burned area estimation of CLM-Fires under different reduced fuel load with population density statistics. Compute a spatial index (e.g. 50x50 km) describing impact of fires on population.

Why have these methods been selected?

  • CLM-Fires allows computation of both the forest fires probability and the carbon emissions related to forest fires. Model includes socioeconomic drivers of forest fires.
  • The simplified version is assumed to be easier for calibration purposes.
  • Because it would be easier to start with a stochasticity introduction and the introduction of different formulations of the human-induced probability related to different adaptation options.
  • Because it is necessary to model different adaptation options with a simple empirical approach.

What results have been obtained?

  • Our estimation of potential increase of annual burned areas in Europe under a high-emissions "no adaptation" scenario is about 200% by 2090, compared to 530 2000- 2008. The application of prescribed burnings has a potential of keeping that increase below 50%. Improvements in fire suppression might reduce this impact even further; e.g. boosting the probability of putting out a fire within a day by 10% country wide would result in about 30% decrease of annual burned area for that particular country.

Reflections on this step

  • Access detection/ response/ suppression times statistics is difficult to access.
  • Possible to analyse the optimal combination of prescribed burning and fire suppression system improvement, but associated costs would be needed.
  • Could use different criteria for optimization e.g. plain burned areas vs. impact on population index (the results will be quite different, as we have seen in our modelling for Spain).

Pathfinder

MEDIATION Toolbox

Toolbox detail page(s) available for methods and tools applied in this case step:

Community Land Model

Details on this case study step


The simplified stand-alone forest fires model (SSFM) has been developed.

Future burned area and fire probability scenarios has been simulated with CLM Fires


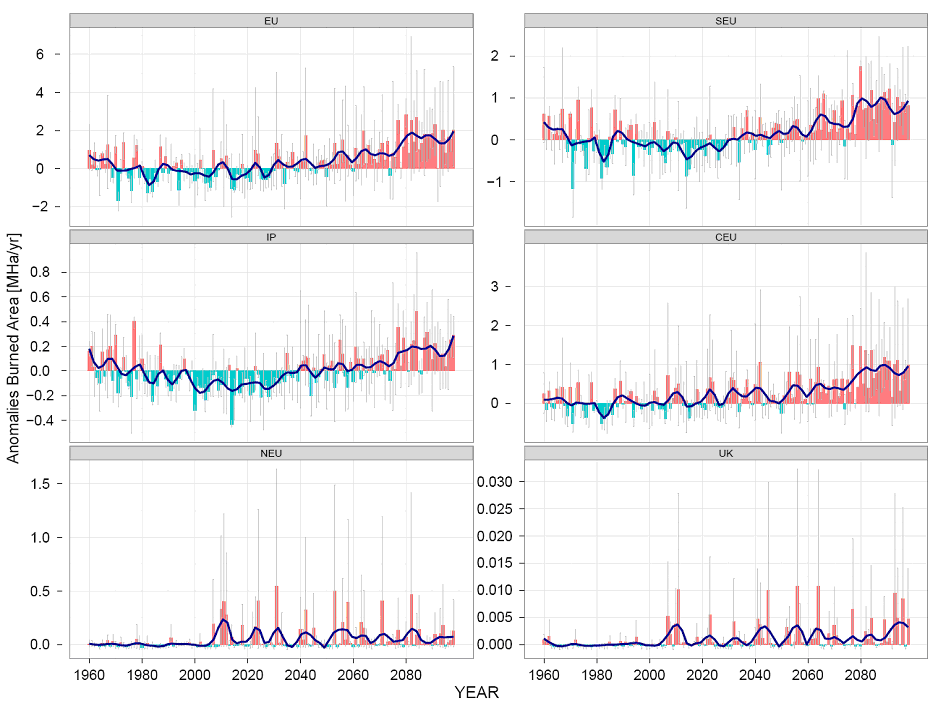
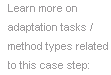
Figure 4 - Anomalies of burned area simulated with CLM Fires for 6 different regions in Europe using 5 different regional climate model projections for the Scenario A1B. Anomalies are computed as the difference between the annual burned area simulated and the baseline (average 1960-1990). Straight lines represent the ensemble average while the vertical grey bars represent the uncertainty. EU represents Europe, SEU represents Southern Europe, IP represents the Iberian Peninsula, CEU represents the Central Europe, NEU the Northern Europe while UK the United Kingdom.


Figure 5 - Fire probability related to biomass (IP_PB), human ignition/suppression (IP_PI) and moisture (IP_PM) simulated with CLM Fires for 6 different regions in Europe using 5 different regional climate model projections for the Scenario A1B. Straight lines represent the ensemble average while the shaded areas represent the uncertainty. Anomalies are computed as the difference between the annual burned area simulated and the baseline (average 1960-1990). EU represents Europe, SEU represents Southern Europe, IP represents the Iberian Peninsula, CEU represents the Central Europe, NEU the Northern Europe while UK the United Kingdom.

The model is driven by meteorological forcing, population density and the amount of fuel and moisture calculated by the CLM. The simplification of the model provided a more flexible modeling tool to test the selected adaptation strategies.

The adaptation options under evaluation are thinning/prescribed burning and allocation of resources for fire suppression (detection/ response time). These options have been selected after the first stake holder consultation held in November 2011.

Practically, the adaptation measures are tested by perturbing the fuel availability (for thinning/prescribed burning) and by modifying the parameters of the fire suppression equation in the model according to a reliable distribution of parameters obtained from the step 1.


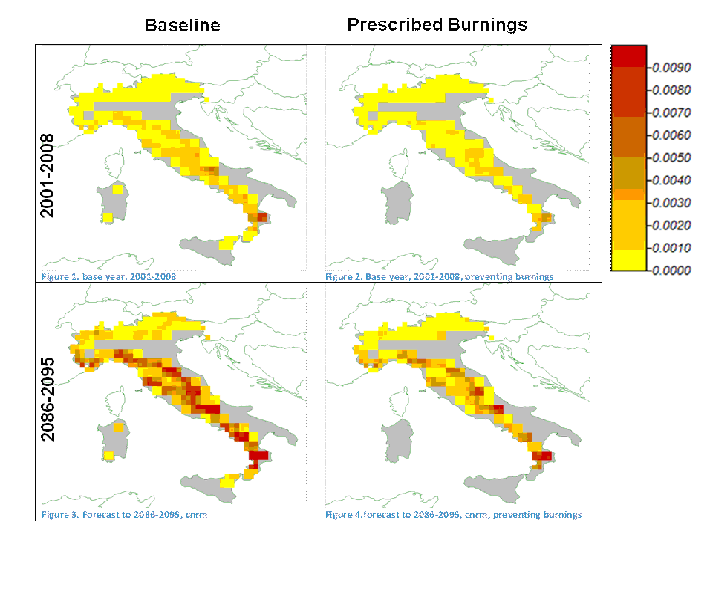
Figure 6 - Variations of fractional burned area as a consequence of prescribed burnings in Italy.

Here is an example of the fire suppression impact on burned areas - a sensitivity analysis with respect to a corresponding parameter of CLM-FM is shown on the figure below:


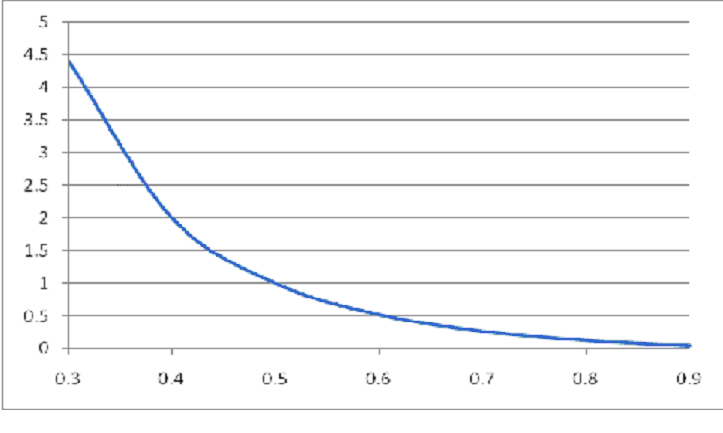
Figure 7 - Sensitivity analysis with respect to q. Ratios with respect to area burned at q=0.5 (baseline value).All other conditions except for q are isolated (fixed).

Here are also some results from our previous modeling exercise (Khabarov N., Moltchanova E., Obersteiner M., Valuing Weather Observation Systems for Forest Fire Management. Systems Journal, IEEE, 2(3):349-357, 2008). Here you can see two curves by how much the necessity of air patrols will be reduced and by how much the burned area will be reduced if you add weather stations in the forest (to better assess fire danger)


As the costs of a weather station, its maintenance, the cost of patrolling of 1 km area, cost of 1 ha forest burned, are not defined - the final costs are not calculated.