Trends
ANOMALY Maps
Maps
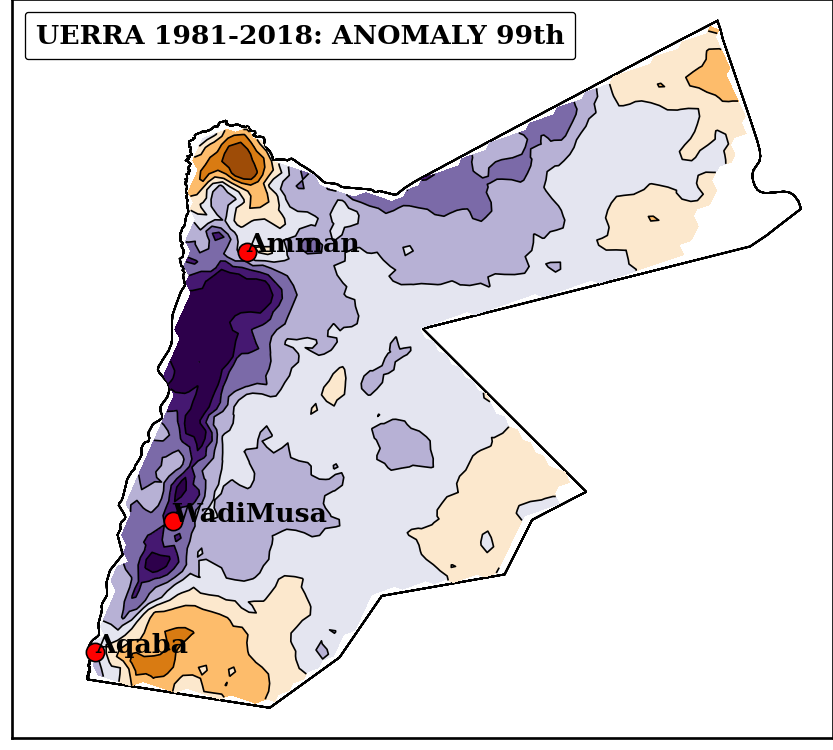
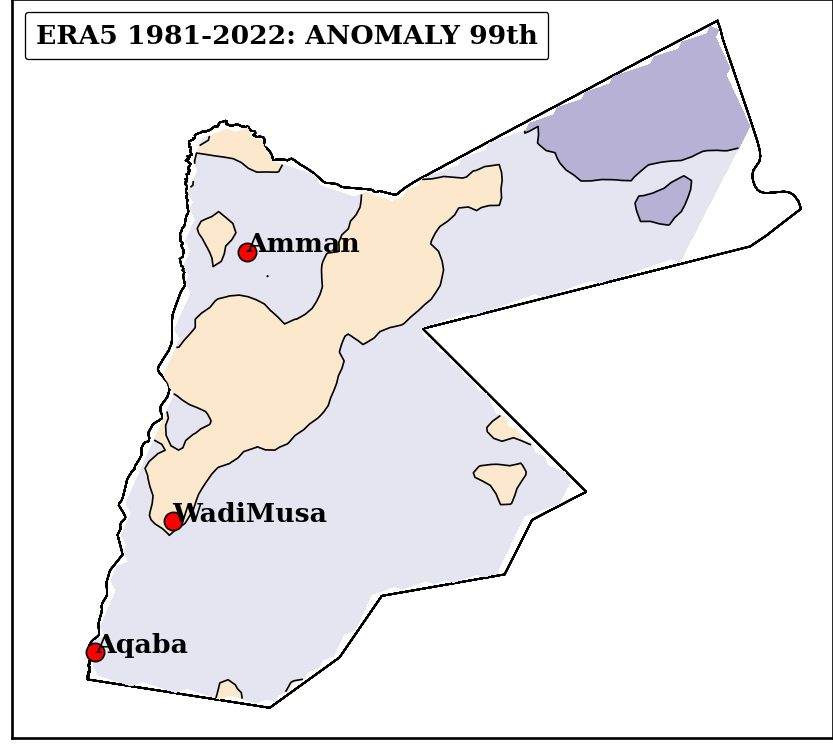
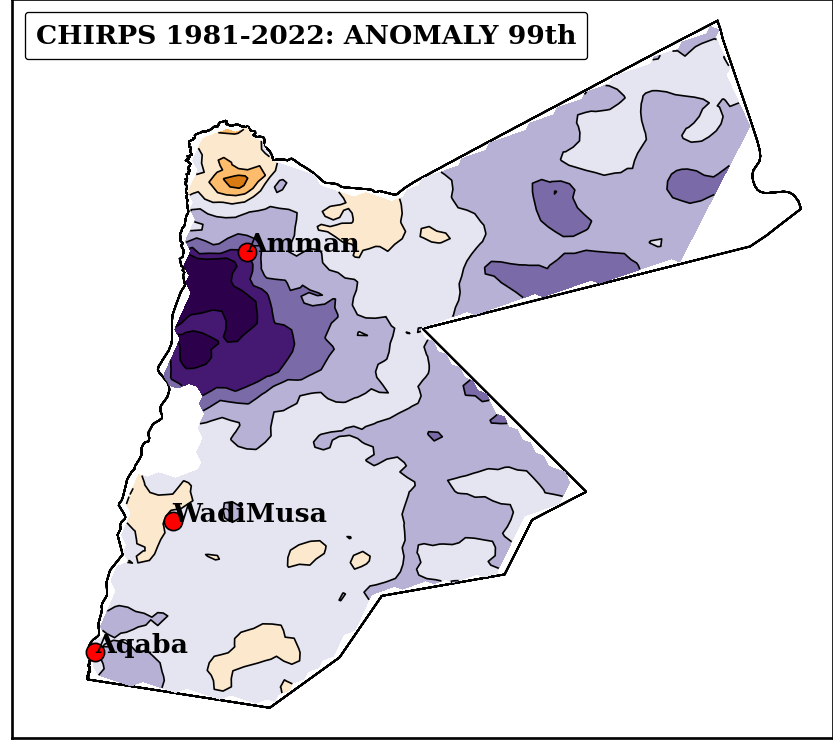
FIGURE: Anomaly maps of the annual 99th percentile of daily precipitation in Jordan between the first and second half of the time period given in mm/d. Three different gridded data products are used (UERRA, ERA5, CHIRPS).
Code
Importing
import matplotlib
matplotlib.use('Agg') # Must be before importing matplotlib.pyplot or pylab!
import matplotlib.pyplot as plt
import matplotlib.pyplot as P
from mpl_toolkits.basemap import Basemap,shiftgrid,maskoceans
from matplotlib.path import Path
from matplotlib.patches import PathPatch
import shapefile
import numpy as N
from netCDF4 import Dataset, num2date,date2num
import datetime
from scipy import signal,stats
import matplotlib.colors as colors
from matplotlib.offsetbox import AnchoredText
import matplotlib as mpl
from scipy import stats as S

plt.style.use('seaborn-talk')

params = {      'legend.fontsize': 8,\
                'font.family': 'serif',\
                }
plt.rcParams.update(params)
Reading
city = {

   'Amman':[35.930359,31.963158],
   'Aqaba':[35.00778,29.52667],
   'WadiMusa':[35.480125,30.321635],
}


datas = ['UERRA','ERA5','CHIRPS']
#modes = ['THRESHOLD','RECORD']

for data in datas:

    if(data=='UERRA'): file = '../../data/ClimateExplorer/tp_daily_uerra_19810101-20181231.cdf'
    if(data=='CHIRPS'): file = '../../data/ClimateExplorer/v2p0chirps_25_34-40E_29-34N.cdf'
    if(data=='ERA5'): file = '../../data/ClimateExplorer/era5_tp_daily_af_34-40E_29-34N_su.cdf'

    nc = Dataset(file,'r')
    lon = N.array(nc.variables['longitude'][:])
    lat = N.array(nc.variables['latitude'][:])
    dat = N.array(nc.variables['tp'][:])
    tim = nc.variables['time']

    print (dat.shape,N.max(dat),N.min(dat))

    dat[dat>1000] = N.nan

    tim = num2date(tim[:],units=tim.units,calendar=tim.calendar)

    jj = []
    mm = []
    dd = []

    for it in tim:

        jj.append(it.year)
        mm.append(it.month)
        dd.append(it.day)

    jj = N.array(jj)
    mm = N.array(mm)
    dd = N.array(dd)

    #id = N.where((jj>=1981)&(jj<=2018))[0]
    #jj = jj[id]

    nc.close()

    #dat = dat[id,:,:]

    nd = dat.shape[0]
    ny = dat.shape[1]
    nx = dat.shape[2]

    jo = N.arange(jj.min(),jj.max(),1)
    nj = len(jo)

    #xnew = N.linspace(jj.min(),jj.max(),40)

    tmp = N.zeros((nj,ny,nx),float)
    #tmp[:,:,:] = N.nan

    for y in range(ny):

        print (y)

        for x in range(nx):

            for j in range(nj):

                id = N.where(jj==jo[j])[0]

                tmp[j,y,x] = N.percentile(dat[id,y,x],99)

            #id = N.where((jj>=1981)&(jj<=2010))[0]
            #rx = N.percentile(dat[id,y,x],95)

            #xx = []

            #for d in range(nd):

            #    if((dat[d,y,x]>rx)&(dat[d,y,x]<1000.)):

            #         xx.append(jj[d])

            #xx = N.array(xx)

            #if(len(xx)>0):

            #    density = S.kde.gaussian_kde(xx)

            #    tmp[:,y,x] = density(xnew)

    Z2 = N.nanmean(tmp[20:,:,:],0)-N.nanmean(tmp[:20,:,:],0)

    #id = N.where((jj>=1981)&(jj<=2010))[0]

    #Z2 = N.percentile(dat[id,:,:],98,axis=0)

    #print (N.nanmax(Z2))

    fig = P.figure(figsize=(8,4))
    ax = P.subplot(111)

    m = Basemap(projection='cyl',llcrnrlat=29,urcrnrlat=33.5,llcrnrlon=34.5,urcrnrlon=39.5,resolution='h')
    #m.drawcountries()
    #m.drawcoastlines()

    xx,yy = m(lon,lat)

    lev = N.linspace(-30,30,9)

    cl = m.contourf(xx,yy,10.*Z2,levels=lev,cmap=P.get_cmap('PuOr_r'),extend='both',zorder=4)
    cs = m.contour(xx,yy,10.*Z2,levels=lev,colors='k',linestyles='solid',zorder=5,linewidths=0.5)
    #P.clabel(cs,cs.levels,inline=True,fmt='%2.1f', fontsize=8)

    jmin = N.min(jj)
    jmax = N.max(jj)

    at = AnchoredText('%s %i-%i: %s'%(data,jmin,jmax,'ANOMALY 99th'),prop=dict(size=8,weight='bold'),frameon=True,loc='upper left')
    at.patch.set_boxstyle("round,pad=0.,rounding_size=0.1")
    ax.add_artist(at)

    #at = AnchoredText('99th = %.1f mm/d'%(rx),prop=dict(size=6,weight='bold'),frameon=True,loc='lower left')
    #at.patch.set_boxstyle("round,pad=0.,rounding_size=0.1")
    #ax.add_artist(at)

    for c in city:

         x,y = m(city[c][0],city[c][1])

         m.scatter(x,y,s=30,c='r',ec='k',lw=0.5,zorder=9)
         plt.text(x,y,c,fontsize=8,weight='bold',zorder=10)

    #m.readshapefile('../../data/shp/geo/gw-basins_wgs84','comarques',zorder=6,color='gray')#,drawbounds = False)

    sf = shapefile.Reader("../../data/shp/JOR_adm0")

    for shape_rec in sf.shapeRecords():
            if shape_rec.record[1] == 'JOR':
                vertices = []
                codes = []
                pts = shape_rec.shape.points
                prt = list(shape_rec.shape.parts) + [len(pts)]
                for i in range(len(prt) - 1):
                    for j in range(prt[i], prt[i+1]):
                        vertices.append(m(pts[j][0], pts[j][1]))
                    codes += [Path.MOVETO]
                    codes += [Path.LINETO] * (prt[i+1] - prt[i] -2)
                    codes += [Path.CLOSEPOLY]
                clip = Path(vertices, codes)
                clip = PathPatch(clip, transform=ax.transData,fill=False,lw=0.5)

    for contour in cs.collections:
            contour.set_clip_path(clip)
            ax.add_patch(clip)

    for contour in cl.collections:
            contour.set_clip_path(clip)
            ax.add_patch(clip)

    #ax.axis('off')

    #ax1 = fig.add_axes([0.64, 0.15, 0.02, 0.35])

    #cb = mpl.colorbar.ColorbarBase(ax1,cmap=plt.get_cmap('terrain'),spacing='uniform',orientation='vertical',boundaries=lev,extend='both')
    #cb.set_label('Prob.',labelpad=-30,y=1.2,rotation=0,fontsize=10,weight='bold')
    #cb.ax.tick_params(labelsize=10)
    #cb.solids.set_rasterized(True)
    #cb.solids.set_edgecolor("k")

    plt.savefig('./img/%s_TRENDS.png'%(data),dpi=240,transparent=False,bbox_inches='tight',pad_inches=0.0)