Composite
| Circulation |
Rainfall |
 |
 |
Code
Importing
import sys
import os
import matplotlib
matplotlib.use('Agg') # Must be before importing matplotlib.pyplot or pylab!
import matplotlib.pyplot as P
from mpl_toolkits.basemap import Basemap,shiftgrid
from netCDF4 import Dataset
import numpy as N
from netCDF4 import Dataset, num2date,date2num
from datetime import datetime
from matplotlib.offsetbox import AnchoredText
from skimage.metrics import structural_similarity as ssim
from matplotlib.colors import LightSource
from matplotlib import cm
import shapefile
from matplotlib.path import Path
from matplotlib.patches import PathPatch
Setting
P.style.use('seaborn-talk')

params = {      'legend.fontsize': 8,\
                'font.family': 'serif',\
                }
P.rcParams.update(params)
Reading
file = '../../data/ncep/z500_day_ncep_19810101-20211231_eu_rm3.cdf'

nc = Dataset(file,'r')

lon = N.array(nc.variables['lon'][:]);nx = len(lon)
lat = N.array(nc.variables['lat'][:]);ny = len(lat)
dat = N.array(nc.variables['phi'][:])
tim = nc.variables['T']

tim = num2date(tim[:], units=tim.units,calendar=tim.calendar)

dates = []

for it in tim:

    dates.append('%04i-%02i-%02i'%(it.year,it.month,it.day))

dates = N.array(dates)

nc.close()

x0 = N.min(lon)
x1 = N.max(lon)
y0 = N.min(lat)
y1 = N.max(lat)

print (dat.shape)
Processing
liste = [

   '2004-11-22',
   '2002-12-20',
   '2013-01-08',
   '2019-02-28',
   '2012-03-01',
   '2006-04-02',
   '2010-01-18',
   '2019-12-26',
   '2018-01-05',
   '2014-11-26',
   '2009-02-21',
   '2002-01-09',
   '2013-12-11',
   '2016-12-14',
   '2000-01-27',
   '2005-12-24',
   '2018-12-27',
   '2013-01-09',
   '2004-11-26',
   '2016-01-01'
]

nl = len(liste)

tmp = N.zeros((nl,ny,nx),float)

i = -1

for l in liste:

    i = i+1

    id = N.where(l==dates)[0]
    id = id[0]

    dum = (dat[id,0,:,:]-N.min(dat[id,0,:,:]))/N.ptp(dat[id,0,:,:])

    tmp[i,:,:] = dum

avg = N.mean(tmp,0)
std = N.std(tmp,0)
Mapping
P.figure(figsize=(8,5))
ax = P.subplot(111)
m = Basemap(projection='merc',llcrnrlat=y0,urcrnrlat=y1,llcrnrlon=x0,urcrnrlon=x1,lat_ts=50,resolution='h')
m.shadedrelief()
m.drawcoastlines(color='k',linewidth=0.5)
xx,yy = m(*N.meshgrid(lon,lat))
#ls = LightSource(270,0)# 45)
#rgb = ls.shade(avg, cmap=cm.terrain, vert_exag=0.1, blend_mode='overlay',vmin=0.2,vmax=1.1)
#m.imshow(rgb,interpolation='nearest')
m.contour(xx,yy,avg,levels=N.linspace(0.2,0.9,15),colors='k',linewidths=2.5,zorder=7)
m.contour(xx,yy,avg,levels=N.linspace(0.2,0.9,15),cmap=P.get_cmap('terrain'),linewidths=1.0,zorder=8)
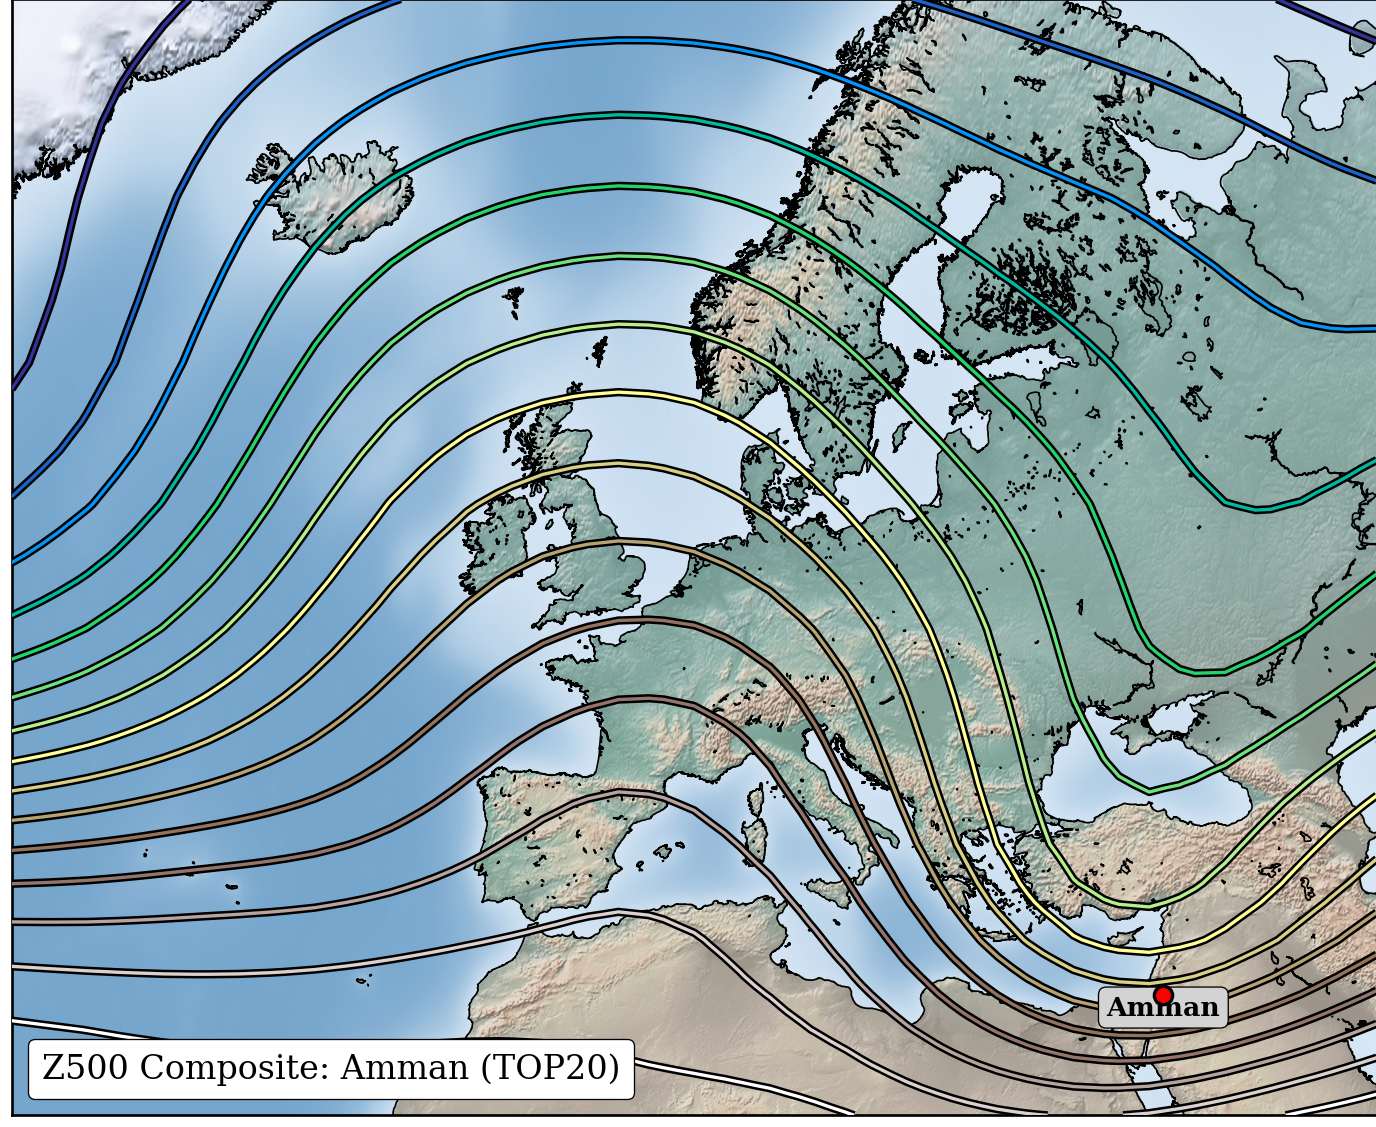
at = AnchoredText('Z500 Composite: Amman (TOP%i)'%nl,prop=dict(size=10),frameon=True,loc='lower left')
at.patch.set_boxstyle("round,pad=0.,rounding_size=0.2")
at.zorder = 20
ax.add_artist(at)
x = 35.930359
y = 31.963158
x,y = m(x,y)
P.scatter(x,y,s=30,fc='r',ec='k',lw=1.0,zorder=20)
P.text(x,y, 'Amman',color='k',ha='center',va='top',weight='bold',fontsize=8,wrap=True,bbox=dict(facecolor='lightgray', edgecolor='k', boxstyle='round'),zorder=19)
P.tight_layout()
P.savefig('./img/composite.png',dpi=240,transparent=False,bbox_inches='tight',pad_inches=0.0)
Rainfall
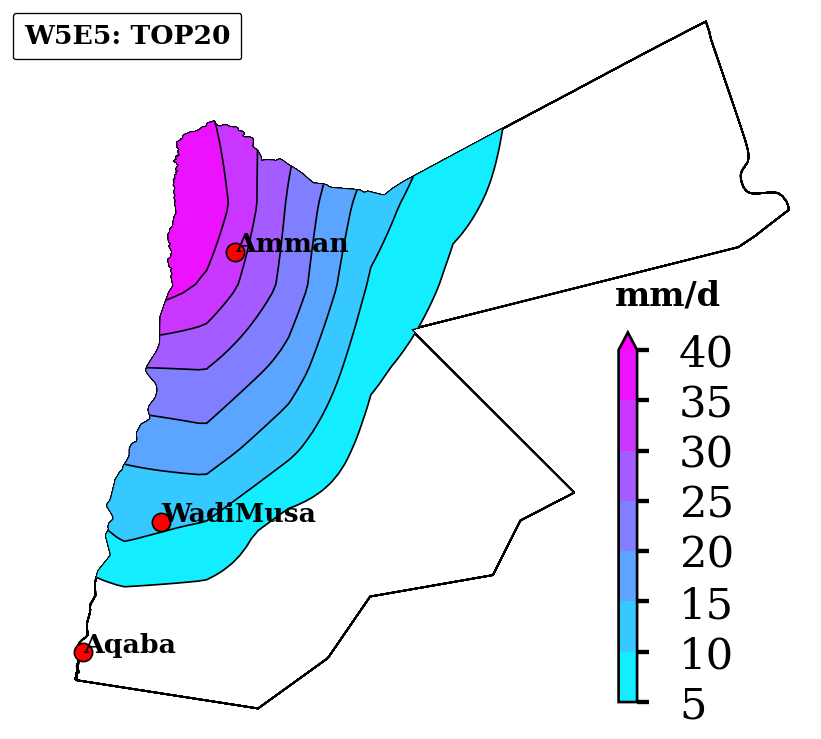
city = {

   'Amman':[35.930359,31.963158],
   'Aqaba':[35.00778,29.52667],
   'WadiMusa':[35.480125,30.321635],
}

file = '../../data/ClimateExplorer/pr_W5E5v2.0_19810101-20191231.cdf'

nc = Dataset(file,'r')
lon = N.array(nc.variables['lon'][:]);nx = len(lon)
lat = N.array(nc.variables['lat'][:]);ny = len(lat)
dat = N.array(nc.variables['tp'][:])
tim = nc.variables['time']

print (dat.shape)

dat[dat>1000] = N.nan

tim = num2date(tim[:],units=tim.units,calendar=tim.calendar)

dd = []

for it in tim:

    dd.append('%04i-%02i-%02i'%(it.year,it.month,it.day))

dd = N.array(dd)

nc.close()

print (dd)

tmp = N.zeros((nl,ny,nx),float)

i = -1

for l in liste:

    i = i+1

    id = N.where(l==dd)[0]
    id = id[0]

    dum = dat[id,:,:]

    tmp[i,:,:] = dum

avg = N.nanmean(tmp,0)

print (avg)


fig = P.figure(figsize=(8,4))
ax = P.subplot(111)

m = Basemap(projection='cyl',llcrnrlat=29,urcrnrlat=33.5,llcrnrlon=34.5,urcrnrlon=39.5,resolution='h')

xx,yy = m(*N.meshgrid(lon,lat))

lev = [5,10,15,20,25,30,35,40]

cl = m.contourf(xx,yy,avg,levels=lev,cmap=P.get_cmap('cool'),extend='max',zorder=4)
cs = m.contour(xx,yy,avg,levels=lev,colors='k',linestyles='solid',zorder=5,linewidths=0.5)
cb = fig.colorbar(cl,location='right',shrink=0.5,pad=-0.15,anchor=(0.1, 0.1))

cb.set_label('mm/d',labelpad=-20,y=1.2,rotation=0,fontsize=10,weight='bold')

at = AnchoredText('W5E5: TOP%i'%nl,prop=dict(size=8,weight='bold'),frameon=True,loc='upper left')
at.patch.set_boxstyle("round,pad=0.,rounding_size=0.1")
ax.add_artist(at)

for c in city:

    x,y = m(city[c][0],city[c][1])

    m.scatter(x,y,s=30,c='r',ec='k',lw=0.5,zorder=9)
    P.text(x,y,c,fontsize=8,weight='bold',zorder=10)

sf = shapefile.Reader("../../data/shp/JOR_adm0")

for shape_rec in sf.shapeRecords():
            if shape_rec.record[1] == 'JOR':
                vertices = []
                codes = []
                pts = shape_rec.shape.points
                prt = list(shape_rec.shape.parts) + [len(pts)]
                for i in range(len(prt) - 1):
                    for j in range(prt[i], prt[i+1]):
                        vertices.append(m(pts[j][0], pts[j][1]))
                    codes += [Path.MOVETO]
                    codes += [Path.LINETO] * (prt[i+1] - prt[i] -2)
                    codes += [Path.CLOSEPOLY]
                clip = Path(vertices, codes)
                clip = PathPatch(clip, transform=ax.transData,fill=False,lw=0.5)

for contour in cl.collections:
           contour.set_clip_path(clip)
           ax.add_patch(clip)

for contour in cs.collections:
           contour.set_clip_path(clip)
           ax.add_patch(clip)

ax.axis('off')

P.savefig('./img/composite0.png',dpi=240,transparent=True,bbox_inches='tight',pad_inches=0.0)
3D
avg = avg[::-1,:]
lat = lat[::-1]

print (N.min(avg),N.max(avg))

xx,yy = N.meshgrid(lon,lat)

from matplotlib.colors import LightSource
from matplotlib import cm

fig, ax = P.subplots(figsize=(8,5))#subplot_kw=dict(projection='3d'))

ls = LightSource(270,0)# 45)
rgb = ls.shade(avg, cmap=cm.terrain, vert_exag=0.1, blend_mode='overlay',vmin=0.2,vmax=1.1)
#rgb = ls.hillshade(avg, vert_exag=0.1, dx=1, dy=1)
ax.imshow(rgb)

ax.set_xticks(N.arange(nx)[::10])
ax.set_xticklabels(N.array(lon,str)[::10])

ax.set_yticks(N.arange(ny)[::5])
ax.set_yticklabels(N.array(lat,str)[::5])

#ax.grid(lw=0.5,ls=':',color='k')

#ls = LightSource(270, 45)

#rgb = ls.shade(avg,cmap=cm.terrain, vert_exag=0.1, blend_mode='soft')
#ax.plot_surface(xx,yy,avg, rstride=1, cstride=1, facecolors=rgb,linewidth=1, antialiased=True, shade=False)

x = 35.930359
y = 31.963158

distance = (xx-x)**2 + (yy-y)**2
iy,ix = N.where(distance==distance.min())

ax.scatter(ix,iy,ec='k',fc='r',s=50,zorder=10)

x = 13.404954
y = 52.520008

distance = (xx-x)**2 + (yy-y)**2
iy,ix = N.where(distance==distance.min())

ax.scatter(ix,iy,ec='k',fc='r',s=50,zorder=10)


fig.savefig('./img/3D.png',dpi=480,transparent=True)