GSMaP
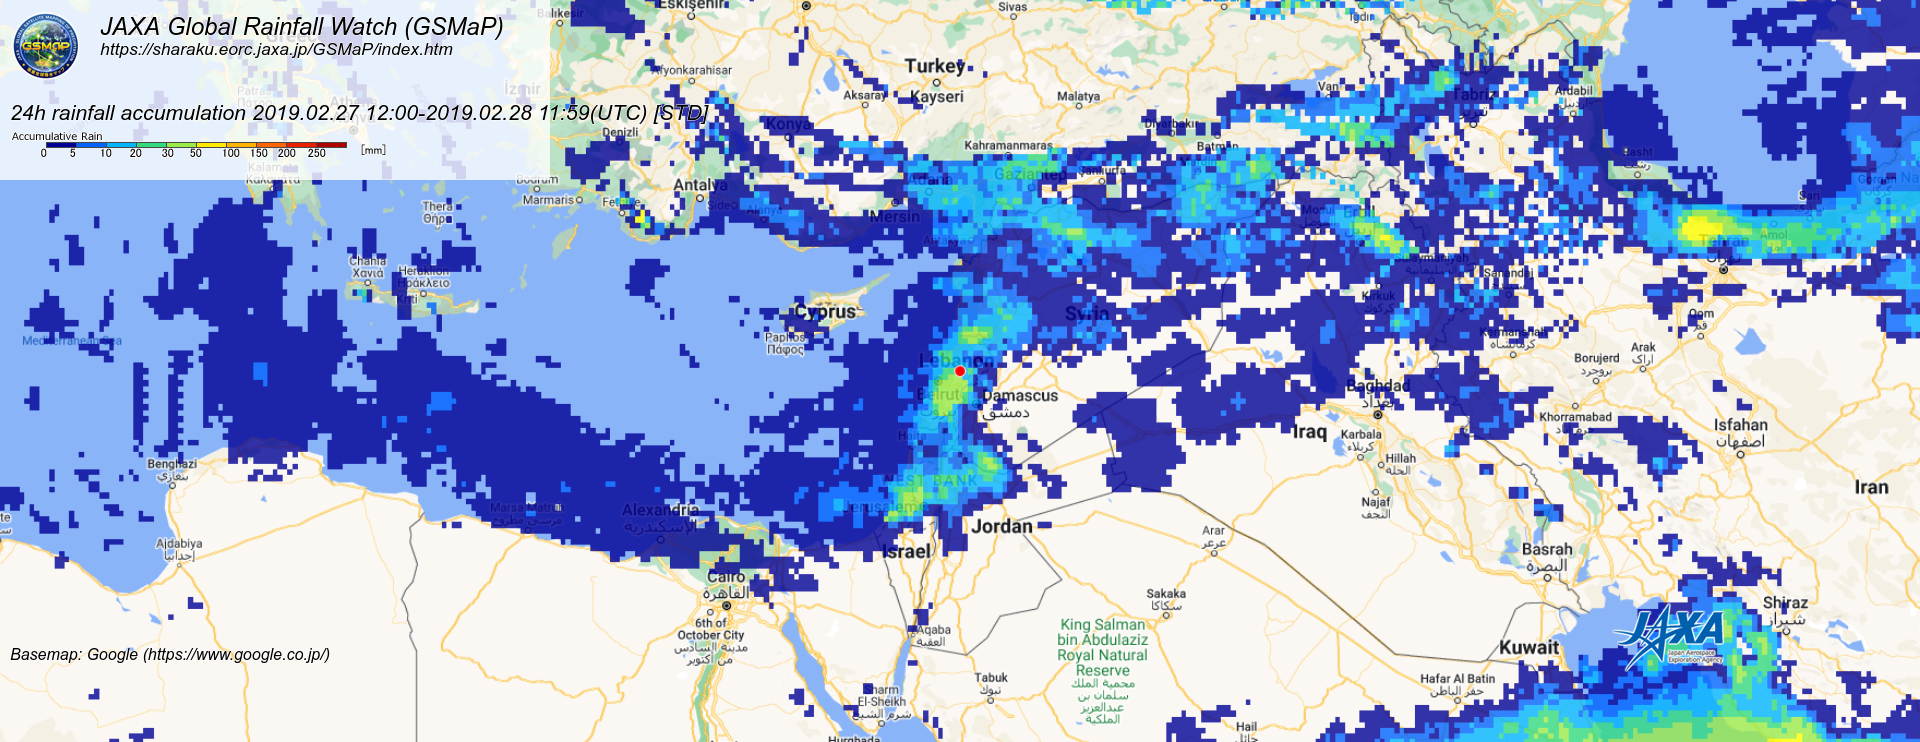
Figure: https://sharaku.eorc.jaxa.jp/GSMaP/index.htm
Hourly
Amman
Chart
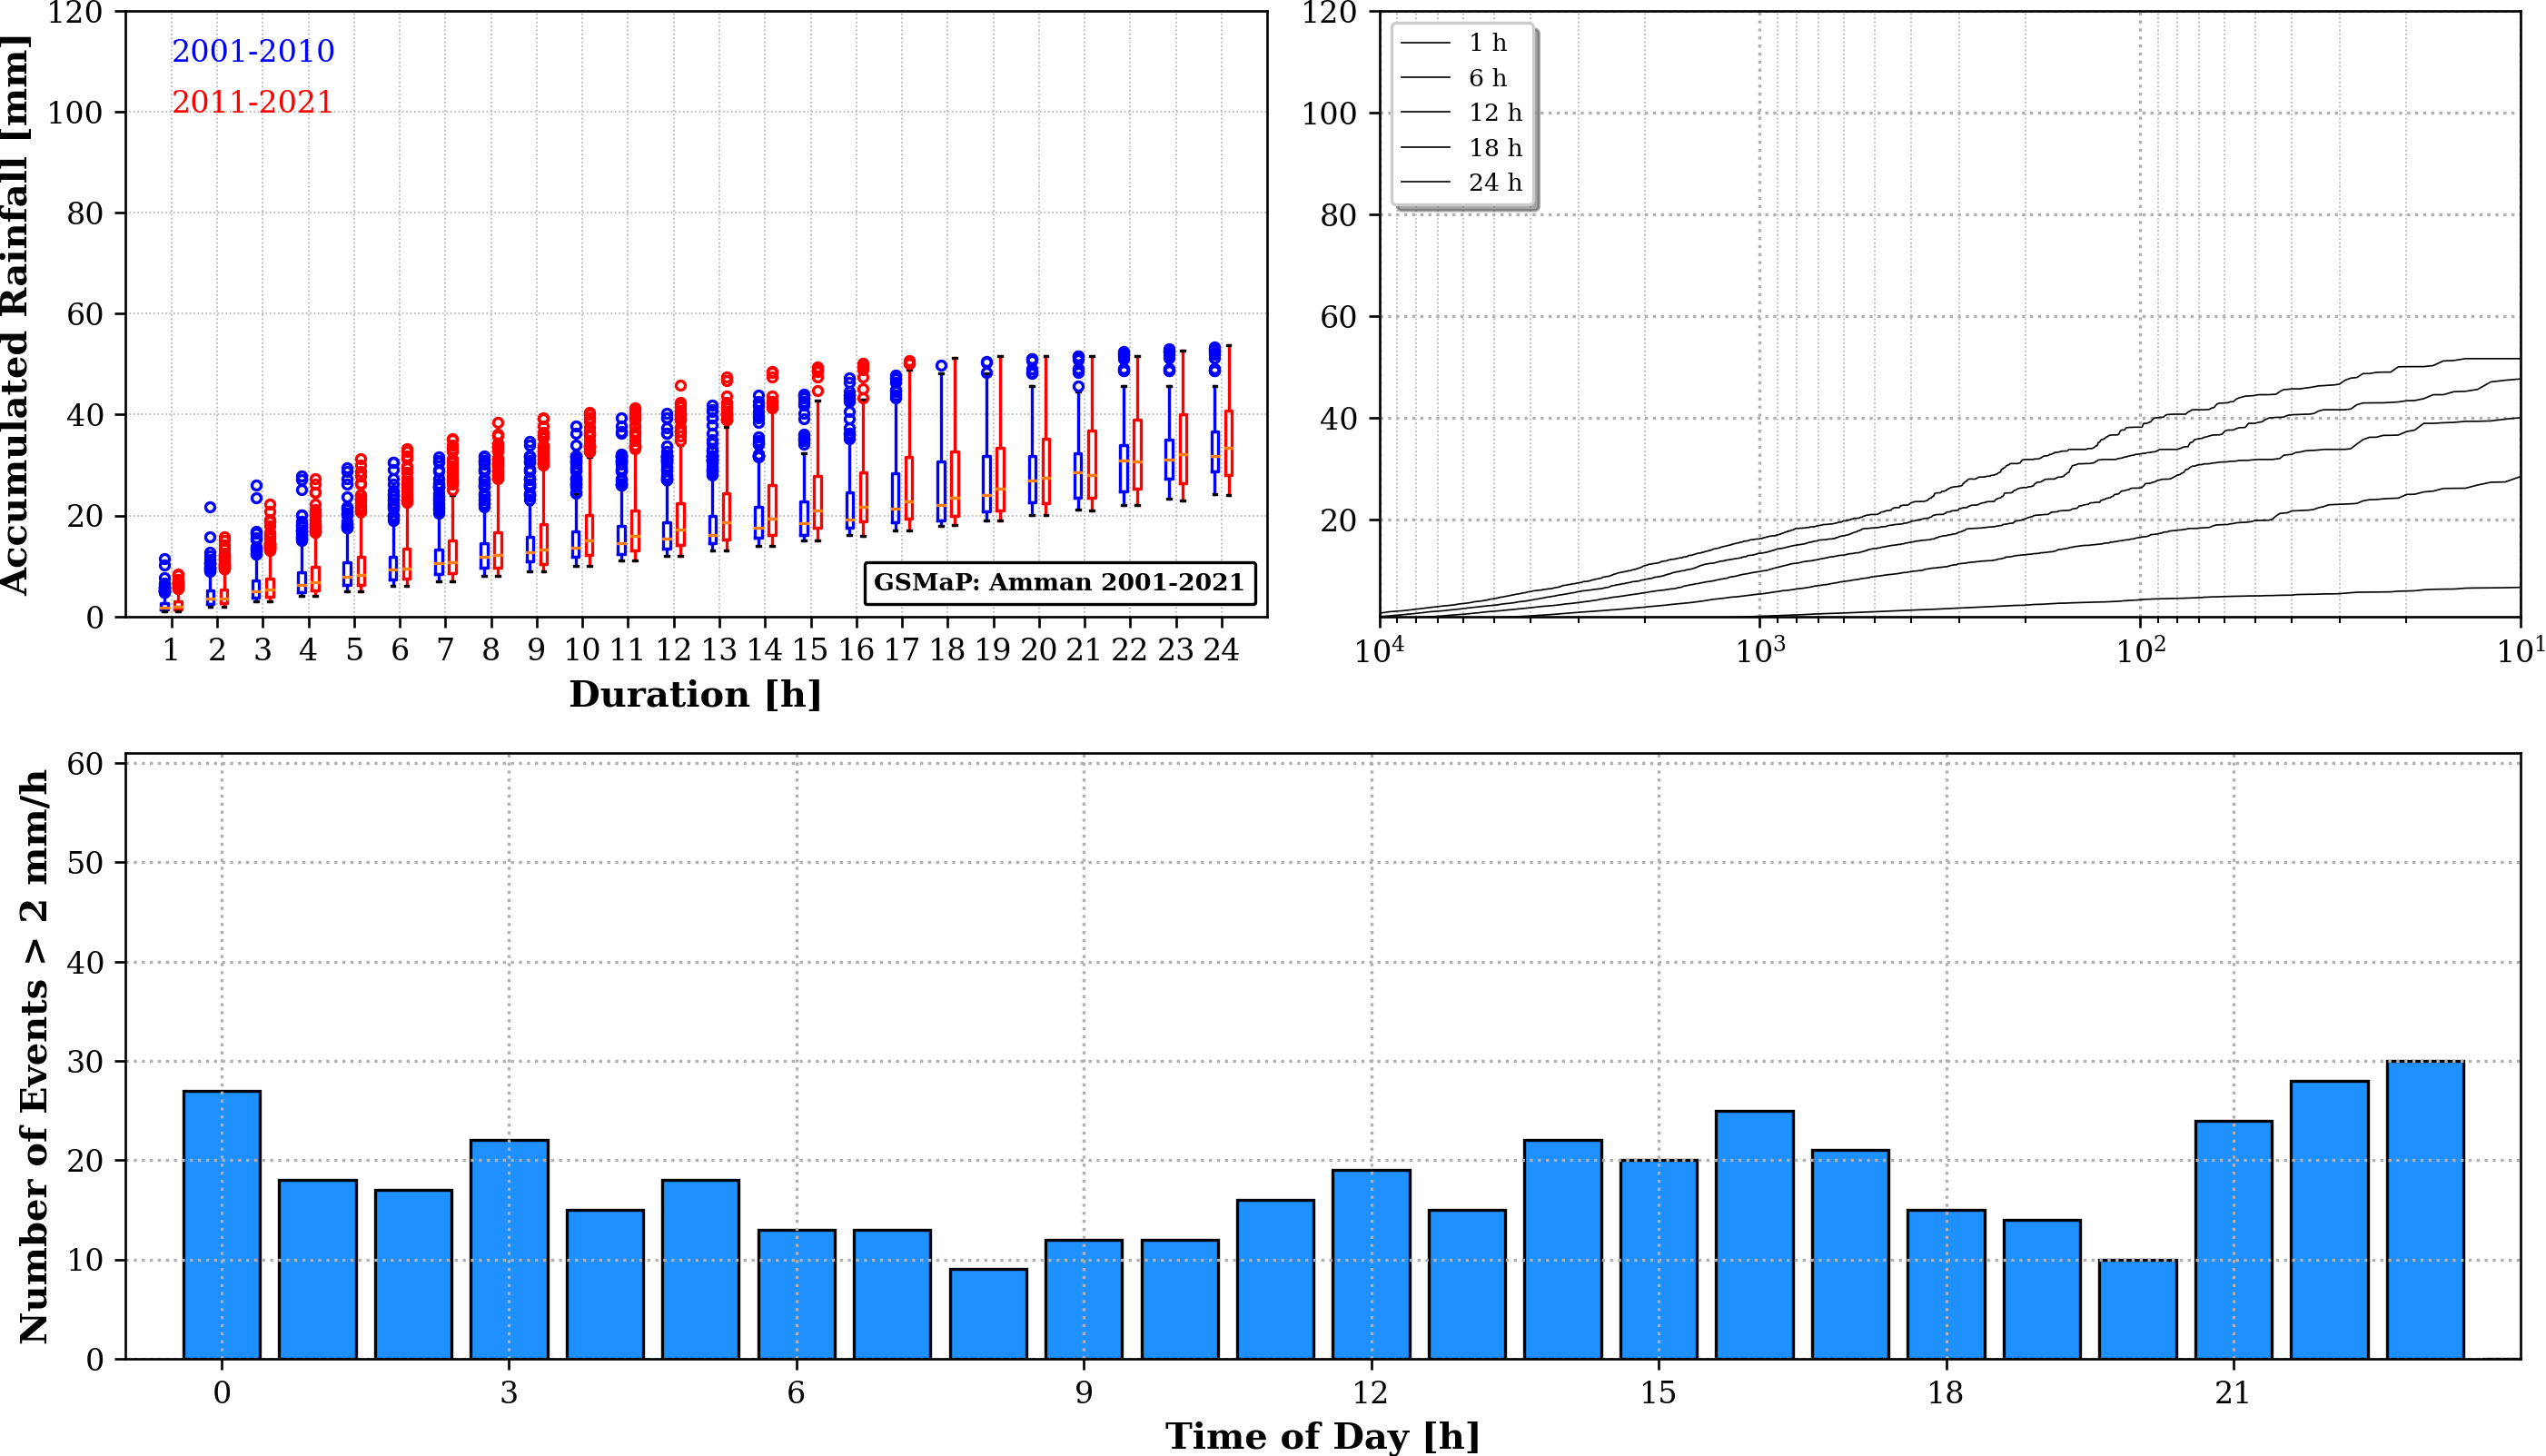
Amman 2001-2021
Figure: upper left: Distribution of accumulated rainfall 1-24 h: 2001-2010 (blue) and 2011-2021 (red). upper right: Lines of sorted rainfall intensities from 2001-2021 for 1h, 6h, 12h, 18h and 24h accumulation. bottom: Density function of hourly rainfall >2 mm dependent on hour of day.
Table
Table: Return periods of annual maximum of hourly to daily rainfall estimates from GSMaP (2001-2021) for Amman.
| Amman | 2 yr | 5 yr | 10 yr | 20 yr | 50yr | 100 yr | GEV |
|---|---|---|---|---|---|---|---|
| 01 h | 6.0 | 7.5 | 8.4 | 9.3 | 10.4 | 11.2 | 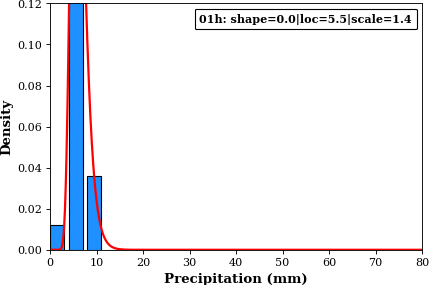 |
| 02 h | 10.3 | 13.2 | 15.1 | 16.9 | 19.3 | 21.1 | 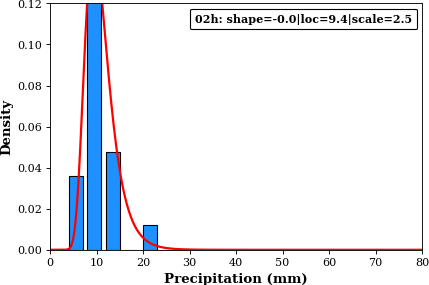 |
| 03 h | 12.9 | 16.5 | 19.1 | 21.8 | 25.6 | 28.7 | 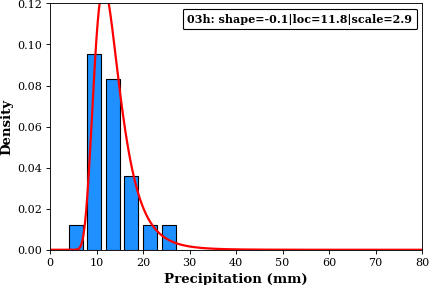 |
| 04 h | 15.1 | 19.3 | 22.3 | 25.3 | 29.5 | 32.7 | 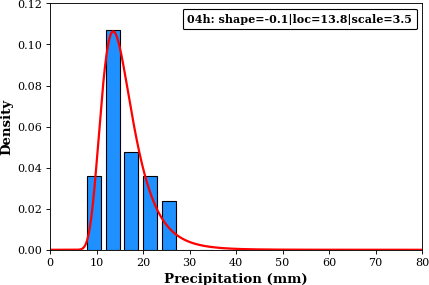 |
| 05 h | 16.7 | 21.5 | 25.1 | 28.8 | 34.0 | 38.3 | 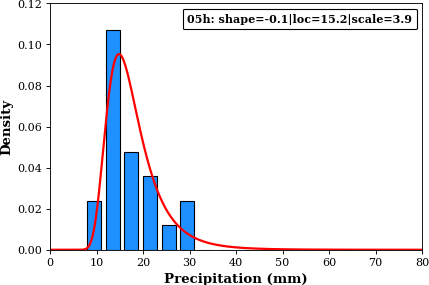 |
| 06 h | 18.1 | 23.6 | 27.8 | 32.4 | 39.1 | 44.9 | 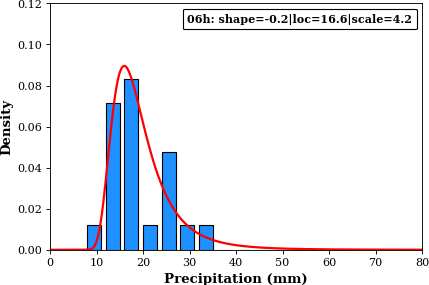 |
| 07 h | 19.6 | 25.7 | 30.1 | 34.7 | 41.1 | 46.3 | 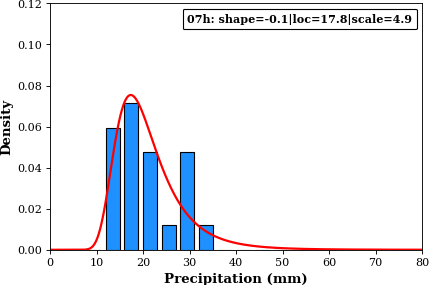 |
| 08 h | 20.6 | 27.6 | 32.8 | 38.1 | 45.6 | 51.7 | 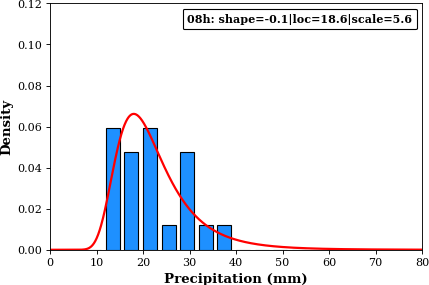 |
| 09 h | 20.8 | 28.6 | 35.3 | 43.3 | 56.5 | 68.9 | 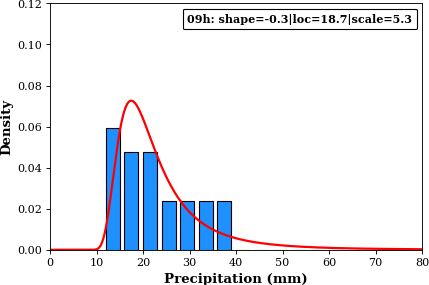 |
| 10 h | 22.0 | 30.2 | 36.9 | 44.4 | 56.1 | 66.4 | 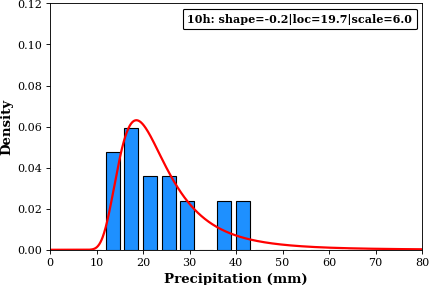 |
| 11 h | 23.2 | 31.6 | 37.9 | 44.7 | 54.6 | 62.9 | 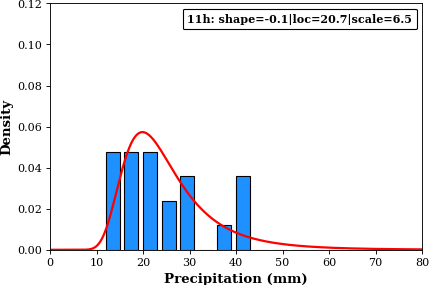 |
| 12 h | 23.5 | 32.4 | 39.7 | 48.1 | 61.3 | 73.3 | 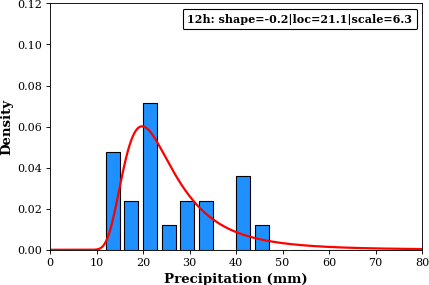 |
| 13 h | 24.1 | 33.1 | 40.5 | 49.0 | 62.5 | 74.8 | 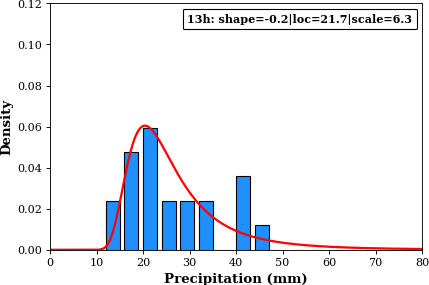 |
| 14 h | 24.5 | 33.5 | 41.0 | 49.5 | 62.8 | 74.9 | 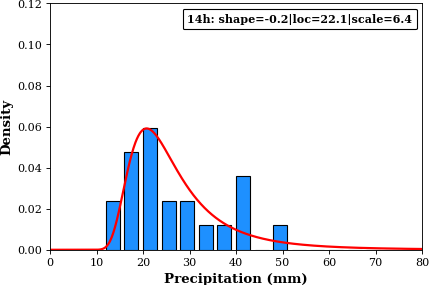 |
| 15 h | 24.8 | 33.9 | 41.4 | 49.8 | 62.9 | 74.7 | 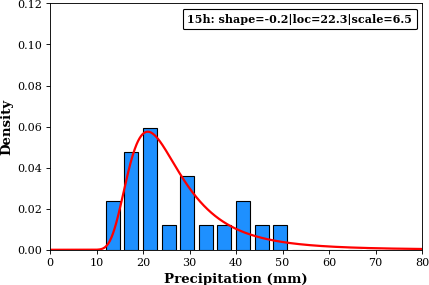 |
| 16 h | 25.0 | 34.4 | 42.2 | 51.2 | 65.2 | 78.0 | 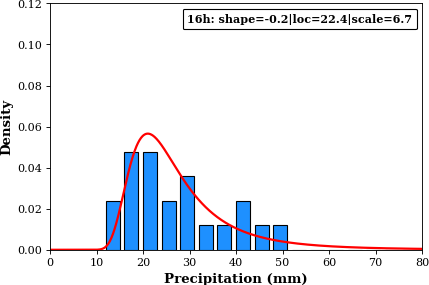 |
| 17 h | 25.2 | 34.8 | 42.5 | 51.2 | 64.6 | 76.5 | 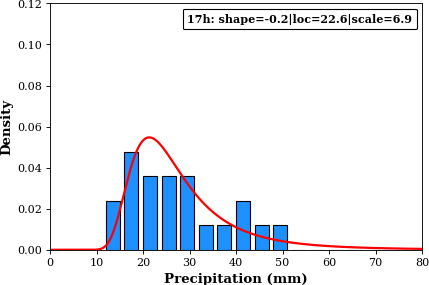 |
| 18 h | 25.8 | 35.7 | 43.6 | 52.4 | 66.0 | 77.9 | 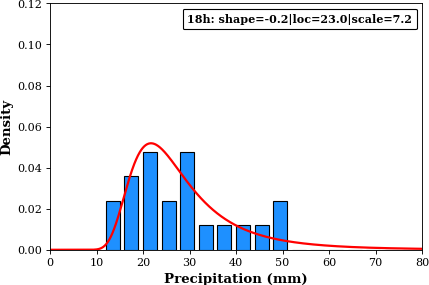 |
| 19 h | 26.0 | 36.1 | 44.2 | 53.4 | 67.7 | 80.6 | 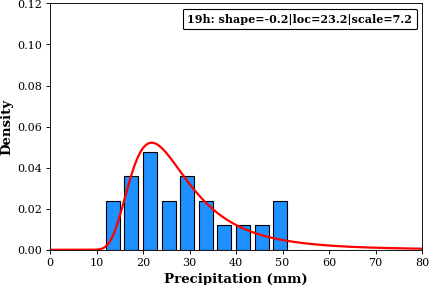 |
| 20 h | 25.8 | 36.0 | 45.1 | 56.4 | 75.5 | 94.3 | 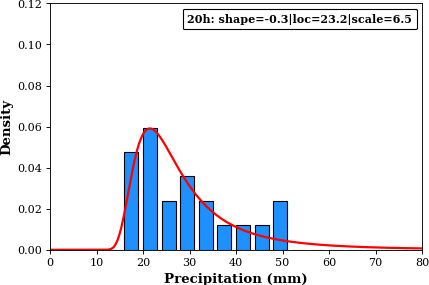 |
| 21 h | 25.7 | 36.2 | 46.3 | 59.4 | 83.0 | 107.5 | 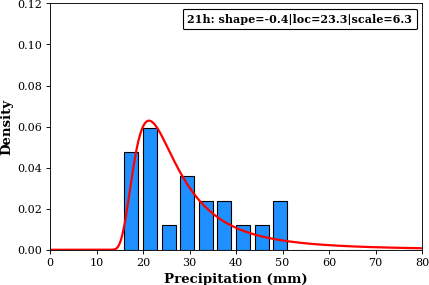 |
| 22 h | 25.7 | 36.4 | 47.1 | 61.2 | 87.4 | 115.4 | 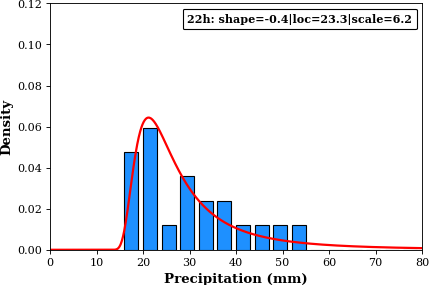 |
| 23 h | 25.6 | 36.6 | 48.2 | 64.2 | 95.7 | 131.0 | 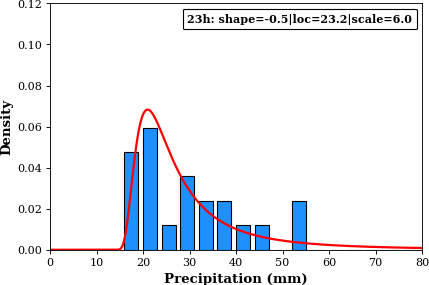 |
| 24 h | 25.5 | 36.7 | 48.8 | 65.9 | 100.3 | 140.0 | 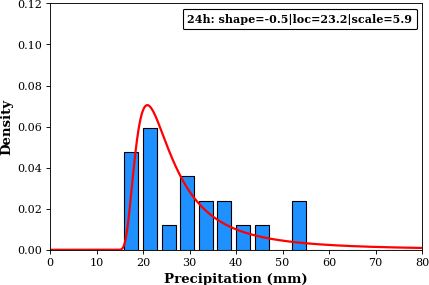 |
Code
Importing
import matplotlib.pyplot as P
import numpy as N
from matplotlib.offsetbox import AnchoredText
from scipy import signal,stats
Setting
params = {'legend.fontsize': 8,\
          'font.family': 'serif'}
P.rcParams.update(params)
````

### Defining

```python
def ma(a,n=3):
    ret=N.cumsum(a,dtype=float)
    ret[n:]=ret[n:]-ret[:-n]
    return ret[n-1:]
Reading
file = '../../data/gsmap/gsmap_amman.csv'
#file = '../../data/gsmap/gsmap_wadimusa.csv'
#file = '../../data/gsmap/gsmap_irbid.csv'
#file = '../../data/gsmap/gsmap_potsdam.csv'
#file = '../../data/gsmap/gsmap_aqaba.csv'

tt = N.genfromtxt(file,usecols=(0),delimiter=',',skip_header=1,dtype='str')
r0 = N.genfromtxt(file,usecols=(1),delimiter=',',skip_header=1,dtype='f')
r1 = N.genfromtxt(file,usecols=(2),delimiter=',',skip_header=1,dtype='f')
r2 = N.genfromtxt(file,usecols=(3),delimiter=',',skip_header=1,dtype='f')

#r0=r2

nh = len(tt)

r0 = r0[:nh-3]

hh = []
dd = []
mm = []
jj = []

for t in tt[3:]:

    jj.append(int(t[0:4]))
    mm.append(int(t[5:7]))
    dd.append(int(t[8:10]))
    hh.append(int(t[11:13]))

jj = N.array(jj)
mm = N.array(mm)
dd = N.array(dd)
hh = N.array(hh)
Processing
ri = N.array([1,2,3,4,5,6,7,8,9,10,11,12,13,14,15,16,17,18,19,20,21,22,23,24])
nr = len(ri)

i0 = N.where((jj>=2001)&(jj<=2010))
i1 = N.where((jj>=2011)&(jj<=2021))
ii = N.where((jj>=2001)&(jj<=2021))


rint0 = {}
rint1 = {}
rint = {}


for i in ri:

    rint0[str(i)] = []

    tmp = ma(r0[i0],i)

    for t in tmp:

        rint0[str(i)].append(t)

    rint1[str(i)] = []

    tmp = ma(r0[i1],i)

    for t in tmp:

        rint1[str(i)].append(t)

    rint[str(i)] = []

    tmp = ma(r0[ii],i)

    for t in tmp:

        rint[str(i)].append(t)
Return Period
import numpy as np
from scipy.stats import genextreme
jo = N.arange(2001,2022,1)
nj = len(jo)
ho = N.arange(1,25,1)
nh = len(ho)
tmp = N.zeros((nj,nh),float)
for j in range(nj):
id = N.where(jj==jo[j])[0]
for h in range(nh):
tmp[j,h] = N.max(ma(r0[id],ho[h]))
print (jo[j],ho[h],tmp[j,h])
return_periods = np.array([2,5,10,20,50,100])
nr = len(return_periods)
lev = N.zeros((nr,nh),float)
for h in range(nh):
data = tmp[:,h]
shape, loc, scale = genextreme.fit(data)
param = genextreme.fit(data)
P.figure(figsize=(6,4))
ax = P.subplot(111)
xx = N.linspace(0,80, num=1000)
yy = genextreme.pdf(xx, shape, loc, scale)
hist, bins = N.histogram(data, bins=20, range=(0,80), density=True)
P.bar(bins[:-1], hist, width = 3, align='edge',fc='dodgerblue',ec='k')
P.plot(xx,yy,'r',lw=2)
P.xlim(0,80)
P.ylim(0,0.12)
P.xlabel('Precipitation (mm)',fontsize=12,weight='bold')
P.ylabel('Density',fontsize=12,weight='bold')
at = AnchoredText('%02ih: shape=%.1f|loc=%.1f|scale=%.1f'%(ho[h],shape,loc,scale),prop=dict(size=10,weight='bold'),frameon=True,loc='upper right')
at.patch.set_boxstyle("round,pad=0.,rounding_size=0.1")
ax.add_artist(at)
P.savefig('./img/gev%02i.png'%ho[h],dpi=80,transparent=True,bbox_inches='tight',pad_inches=0.0)
return_levels = genextreme.isf(1/return_periods, shape, loc, scale)
lev[:,h] = return_levels
f = open('./includes/return_Amman.md','w')
f.write('Amman|%i yr|%i yr|%i yr|%i yr|%iyr|%i yr|GEV\n'%(2,5,10,20,50,100))
f.write('---|---|---|---|---|---|---|---\n')
#lev = N.median(lev,2)
for h in range(nh):
img = '{: style="height:40px;width:100px"}'%ho[h]
f.write('**%02i h**|%.1f|%.1f|%.1f|%.1f|%.1f|%.1f|%s\n'%(ho[h],lev[0,h],lev[1,h],lev[2,h],lev[3,h],lev[4,h],lev[5,h],img))
f.close()
Plotting
fig = P.figure(figsize=(12,7))
ax = P.subplot(221)

blue = dict(marker='o', markeredgecolor='b', markersize=3)
reds = dict(marker='o', markeredgecolor='r', markersize=3)


x = []
y = []
z = []

for i in ri:

    tmp = N.array(rint0[str(i)])
    id = N.where(tmp>i)[0]

    box = P.boxplot(tmp[id],positions=[i-0.15],showfliers=True,zorder=50,flierprops=blue)
    P.setp(box['boxes'], color='b')
    P.setp(box['whiskers'], color='b')

    tmp = N.array(rint1[str(i)])
    id = N.where(tmp>i)[0]

    box = P.boxplot(tmp[id],positions=[i+0.15],showfliers=True,zorder=50,flierprops=reds)
    P.setp(box['boxes'], color='r')
    P.setp(box['whiskers'], color='r')

P.text(1,110,'2001-2010',color='b')
P.text(1,100,'2011-2021',color='r')

P.grid(lw=0.5,ls=':')

P.xlim(0,25)
P.ylim(0,120)
P.xticks(ri,N.array(ri,str))
P.ylabel('Accumulated Rainfall [mm]',fontsize=12,weight='bold')
P.xlabel('Duration [h]',fontsize=12,weight='bold')

at = AnchoredText('GSMaP: Irbid 2001-2021',prop=dict(size=8,weight='bold'),frameon=True,loc='lower right')
at.patch.set_boxstyle("round,pad=0.,rounding_size=0.1")
ax.add_artist(at)

ax = P.subplot(222)

for i in ['1','6','12','18','24']:

    y = N.array(rint[str(i)])
    #id = N.where(y>0)[0]

    y = N.sort(y)
    x = N.arange(1,len(y)+1,1)[::-1]

    P.plot(x,y,'k',lw=0.5,label='%s h'%i)

P.legend(loc=2,shadow=True)

P.ylim(1,120)
P.xlim(10000,10)

P.semilogx()

P.grid(which='major',lw=1.0,ls=':')
P.grid(which='minor',lw=0.5,ls=':')

P.subplot(212)

xnew = N.linspace(-1,24,num=100)

#ii = N.where((r0>1)&(jj>=2001)&(jj<=2010))[0]
#density = stats.kde.gaussian_kde(hh[ii])
#P.plot(xnew,density(xnew),'b',lw=2,label='2001-2010')

#ii = N.where((r0>1)&(jj>=2011)&(jj<=2021))[0]
#density = stats.kde.gaussian_kde(hh[ii])
#P.plot(xnew,density(xnew),'r',lw=2,label='2011-2021')

#ii = N.where((r0>1)&(jj>=2003)&(jj<=2021))[0]
#density = stats.kde.gaussian_kde(hh[ii])
#P.plot(xnew,100.*density(xnew),'r',lw=2,label='2003-2021')

nn = []
tt = N.arange(0,25,1)

for t in tt:

    ii = N.where((r0>2)&(jj>=2003)&(jj<=2021)&(hh==t))[0]

    nn.append(len(ii))

P.bar(tt,nn,0.8,color='dodgerblue',ec='k')

P.xlim(-1,24)
P.ylim(0,61)
P.xticks([0,3,6,9,12,15,18,21])

#P.legend(loc=2,shadow=True)
P.grid(which='major',lw=1.0,ls=':')

P.xlabel('Time of Day [h]',fontsize=12,weight='bold')
P.ylabel('Number of Events > 2 mm/h',fontsize=12,weight='bold')

P.tight_layout()

P.savefig('./img/gsmap.png',dpi=240,transparent=False,bbox_inches='tight',pad_inches=0.0)