
Technical Policy Briefing Notes - 5
Portfolio Analysis
Description of the Method
Policy Briefs
Portfolio Analysis
Description of the Method
Portfolio Analysis (PA) originated in the financial markets
as a way of utilising portfolios of assets to maximise the return on
investments, subject to a given level of risk. The principle is that
spreading investments over a range of asset types also spreads risks.
Since individual assets are likely to have different and unpredictable rates of return over time, an investor may be better in maximising the expected rate of return and minimising the variance and co-variance of their asset portfolio as a whole, rather than managing assets individually (Markowitz, 1952).
As long as the co-variance of assets is low, then the overall portfolio risk is minimised (for a given rate of overall return). Aggregate returns for an individual investor are therefore likely to be higher when low returns on an individual stock are at least partly offset by higher returns from other stocks during the same period.
PA helps in the design of such portfolios. It highlights the trade-off between the returns on an investment and the riskiness of that investment, measuring risk by estimating the variance (standard deviation) of the portfolio return: thus a portfolio with a relatively high (low) variance is judged to have a higher (lower) risk The information on returns and risks is used to identify a portfolio that most closely matches (risk) preferences.
The overall concepts of the approach are fairly straightforward, though the actual analysis is quite complex.
An investor first identifies those portfolios that are efficient (from a longer list of all feasible portfolios). The efficient portfolios have the highest possible expected return for a given risk, or the lowest possible degree of risk for a given mean rate of return (Aerts et. al. 2008). The investor is then able to choose a portfolio that best represents their balance of preferences between risks and returns.
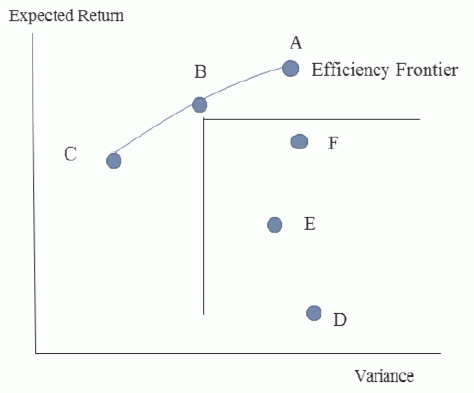
A representation of this choice is given below, plotting the expected return against the variance. In this example, the small circles represent portfolios of two technologies combined in varying proportions. The analysis produces an efficiency frontier, which identifies those portfolios which have the highest return for a given level of variance or, equivalently, the lowest variance for a given return. This is the line from portfolios A to C. These represent the key choice for the investor, and reflect a different mix of risk versus return. It also identifies those portfolios that are inefficient and should be avoided, in this case those located to the bottom-right (i.e. D, E and F).
To derive these values (and figures) a series of analytical steps are taken, set out below.
Since individual assets are likely to have different and unpredictable rates of return over time, an investor may be better in maximising the expected rate of return and minimising the variance and co-variance of their asset portfolio as a whole, rather than managing assets individually (Markowitz, 1952).
As long as the co-variance of assets is low, then the overall portfolio risk is minimised (for a given rate of overall return). Aggregate returns for an individual investor are therefore likely to be higher when low returns on an individual stock are at least partly offset by higher returns from other stocks during the same period.
PA helps in the design of such portfolios. It highlights the trade-off between the returns on an investment and the riskiness of that investment, measuring risk by estimating the variance (standard deviation) of the portfolio return: thus a portfolio with a relatively high (low) variance is judged to have a higher (lower) risk The information on returns and risks is used to identify a portfolio that most closely matches (risk) preferences.
The overall concepts of the approach are fairly straightforward, though the actual analysis is quite complex.
An investor first identifies those portfolios that are efficient (from a longer list of all feasible portfolios). The efficient portfolios have the highest possible expected return for a given risk, or the lowest possible degree of risk for a given mean rate of return (Aerts et. al. 2008). The investor is then able to choose a portfolio that best represents their balance of preferences between risks and returns.
A representation of this choice is given below, plotting the expected return against the variance. In this example, the small circles represent portfolios of two technologies combined in varying proportions. The analysis produces an efficiency frontier, which identifies those portfolios which have the highest return for a given level of variance or, equivalently, the lowest variance for a given return. This is the line from portfolios A to C. These represent the key choice for the investor, and reflect a different mix of risk versus return. It also identifies those portfolios that are inefficient and should be avoided, in this case those located to the bottom-right (i.e. D, E and F).
Figure 1. Risk-Return Space and
the Efficiency Frontier in
Portfolio Analysis
Portfolio Analysis
To derive these values (and figures) a series of analytical steps are taken, set out below.
- First, the objective is established, e.g. to reduce flooding to a 1 in 1000 annual risk.
- The investment possibilities, or adaptation options, are then defined.
- Feasible portfolios are constructed, noting that these may be constrained by the total available budget.
- The returns are defined and measured. These returns can be in economic terms (as in the case of expected values above) but can also be expressed as physical metrics, e.g. the quantity of water conserved.
- The risk is characterised. In portfolio analysis, uncertainty (or more accurately risk) is traditionally characterised in terms of the variance or standard deviation around the mean. This requires probabilities of alternative outcomes since the mean – or expected value – of a distribution is calculated as the sum of all the products of outcomes and their associated probabilities. Probabilities are therefore employed to estimate the Expected NPV (ENPV). The variance of the NPV expresses the risk that the actual (NPV) return will differ from the expected return.
- The expected return of each portfolio is estimated and the efficiency frontier is identified. The risk-return data for each portfolio is estimated by multiplying the ENPV of each asset in the portfolio by the proportion (of cost) of each asset in the portfolio. The risk-return data for each portfolio is combined to create a plot as in Figure 1 above. The efficiency frontier is then defined by the plots of the portfolios whose returns are maximised for a given level of variance.
- The decision-maker defines preferences with respect to returns and risk. The efficiency frontier identifies the optimal risk-return tradeoffs that are available to the decision-maker.
 download this briefing note