Technical Policy Briefing Notes - 5
Portfolio Analysis
Case Studies
Policy Briefs
Portfolio Analysis
Case Studies
The MEDIATION study has reviewed examples in
the existing literature that have applied Portfolio
Analysis to the adaptation context, though a
relatively small number of such applications
currently exist.
A number of the recent case studies applications to adaptation are summarised in the boxes.
A number of the recent case studies applications to adaptation are summarised in the boxes.
Case Study 1: Forest Regeneration
Crowe and Parker (2008) provide an empirical case study of the approach for forest regeneration. The objective of the study was to apply and test the portfolio analysis method for selecting genetic material that could be used for the restoration or regeneration of forests under climate change futures, taking account of the wide range of uncertainty. Data were used to estimate how well different seed populations of White Spruce grew under different climatic conditions. This data, combined with regional climate data under alternative, modelled climate scenarios, allowed a statistical Species-Range Impact Model (SRIM) to estimate how well each population – or seed source – would be adapted to a specific site (under alternative climate futures).
For each seed source, the SRIM estimated the distance over which a seed source was adaptive from any given location, for a given climate future. The estimates of adaptive distances were then utilised in the model to identify the optimal set of seed populations to use in restoring a specific site – optimality being defined as minimising the risk of maladaptation whilst achieving a certain threshold or level of adaptive suitability (the latter defined as the expected adaptive distance of the portfolio). The seed portfolio model aimed to minimise the expected variance and covariance of the adaptive suitability of a portfolio of seed sources subject to a lower bound on the total expected adaptive distance. The weighting of each seed source option within a portfolio was given by the proportion of a portfolio made up by each source, with a minimum proportion specified to avoid the large numbers of sources for regeneration in a given location. A further constraint was introduced for biological thresholds, beyond which species cannot survive. This constraint serves to limit the size of the variance.
A total of 127 white spruce seed sources in Canada were modelled at 6 future time intervals from 2010 to 2060, using temperature and precipitation outputs from five climate scenarios from three climate models. Each scenario was assumed to have an equal probability of occurring. The mean adaptive distances (thenumber of least significant differences between a baseline reference point and a future point) were estimated for several hundred geographical locations. The portfolio model was run for the six time periods, plus all dates combined.
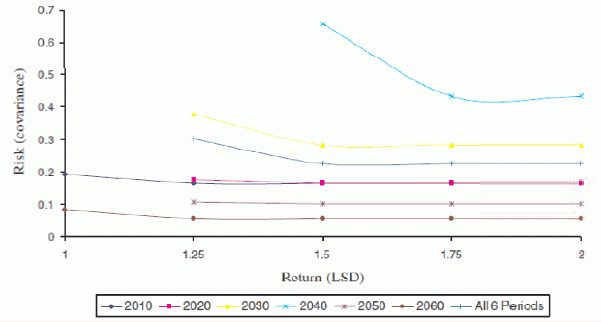
The study found that current locations of seed populations were poor predictors of optimal future locations, confirming the case for adaptation and for adoption of a broad portfolio of seed sources. Conversely, the best matching seed sources differ drastically according to year and time period; The efficiency frontier showed that there were only two unique solutions in each time period, and beyond a certain point risk was not reduced as lower returns were specified. The use of the portfolio approach resulted in covariance being minimised across scenarios, such that the optimality of the seed sources varied according to the scenario, suggesting that the approach is successful in producing an outcome robust to climate change uncertainties. The optimal approach was considered to be a range of specialist seed sources.

(note risk is plotted on the y
axis). Source: Crowe and Parker (2008)
Case Study 2:
Flood Management
Hunt (2009) applied portfolio analysis to a case of flood management at the local geographical scale, for the River Severn in Shrewsbury in the UK. The application considered climate change and socioeconomic change over future decades through to 2050 and changes in flood event frequencies and return periods (up to the 150 year return event).
The application built upon existing decision-support tools used in the UK – primarily cost-benefit analysis – that rely on the monetisation of flood impacts (and the economic benefits of flood protection) to assess investment in flood management. Three alternative and contrasting flood management measures were considered for the portfolio analysis: Hard Defences; Flood Warning Systems, and Property Level Resistance. These were considered against the range of climate and socio-economic uncertainty through to 2050.
Flood event frequencies were analysed and the portfolio returns were measured by the economic efficiency (net present values (NPV), i.e. benefits minus costs in monetary terms) of the flood management options. Benefits included damage avoided to residential and business property, cars and infrastructure, as well as health impacts avoided. The costs were derived from the capital and operating/maintenance costs of each option.
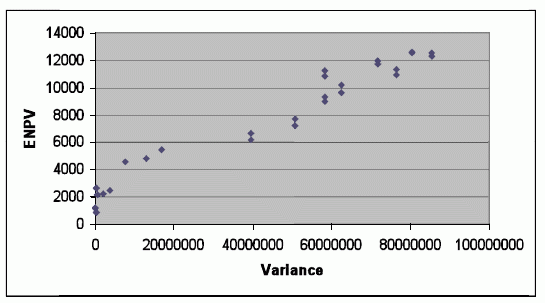
The figure below shows the results of a 2-option portfolio analysis. Each point in the figure represents an individual portfolio comprising of two adaptation options. The figure shows a clear, positive, relationship between return and variance, reflecting the fact that whilst the expected net present value will be higher with the inclusion of some options (e.g. Hard Defence), there is a trade-off with a higher uncertainty of return. The figure also highlights that there are a number of portfolios that are sub-optimal (i.e. those plotted in the south-east quadrant relative to another portfolio).

Two-option Portfolio Analysis: Flood Management:
Assuming independence of options. Source Hunt (2009).
The results above assumed that individual options are independent of each other. However, the implementation of one option may affect the effectiveness (i.e. the benefits) of others. As an example, the implementation of a hard defence system is likely to reduce the subsequent flood risk to properties and so reduce the (economic) benefits from property-based measures or warning systems. When option interdependence was included in the analysis, the return-variance trade-off could still be identified, but the relationship was not as strong as illustrated above.
Hunt (2009) applied portfolio analysis to a case of flood management at the local geographical scale, for the River Severn in Shrewsbury in the UK. The application considered climate change and socioeconomic change over future decades through to 2050 and changes in flood event frequencies and return periods (up to the 150 year return event).
The application built upon existing decision-support tools used in the UK – primarily cost-benefit analysis – that rely on the monetisation of flood impacts (and the economic benefits of flood protection) to assess investment in flood management. Three alternative and contrasting flood management measures were considered for the portfolio analysis: Hard Defences; Flood Warning Systems, and Property Level Resistance. These were considered against the range of climate and socio-economic uncertainty through to 2050.
Flood event frequencies were analysed and the portfolio returns were measured by the economic efficiency (net present values (NPV), i.e. benefits minus costs in monetary terms) of the flood management options. Benefits included damage avoided to residential and business property, cars and infrastructure, as well as health impacts avoided. The costs were derived from the capital and operating/maintenance costs of each option.
The figure below shows the results of a 2-option portfolio analysis. Each point in the figure represents an individual portfolio comprising of two adaptation options. The figure shows a clear, positive, relationship between return and variance, reflecting the fact that whilst the expected net present value will be higher with the inclusion of some options (e.g. Hard Defence), there is a trade-off with a higher uncertainty of return. The figure also highlights that there are a number of portfolios that are sub-optimal (i.e. those plotted in the south-east quadrant relative to another portfolio).

Two-option Portfolio Analysis: Flood Management:
Assuming independence of options. Source Hunt (2009).
The results above assumed that individual options are independent of each other. However, the implementation of one option may affect the effectiveness (i.e. the benefits) of others. As an example, the implementation of a hard defence system is likely to reduce the subsequent flood risk to properties and so reduce the (economic) benefits from property-based measures or warning systems. When option interdependence was included in the analysis, the return-variance trade-off could still be identified, but the relationship was not as strong as illustrated above.
 download this briefing note