You are here: Home / Case studies / WE2 - Turning point analysis of Rhine river policies
case: WE2 location: Rhine basin (Netherlands) sectors: Water resources; Marine and Fisheries

Question

Which question has been addressed in this step?

Exploring risks: What are key impacts of climate on salmon populations in the Rhine?

Case step navigator: click any node to select the respective step

Why has this question been chosen?

  • The impact of changes of the physical system due to climate change are to be identified, and low flow events significantly effect the viability of salmon populations.
  • A limited number of scientific publications on the Atlantic Salmon exists.

Which methods have been applied?

  • Inventory of climate related factors potentially influencing the proliferation of Atlantic salmon on the basis of reports, scientific literature and four interviews with experts on Atlantic salmon. Priority of factors is based on literature and expert judgement of potential declines in salmon populations. Physical water temperature limits for salmon were selected based on literature study.

Why have these methods been selected?

  • System understanding: the relationships between upstream migration at different river sections and climate related parameters such as water temperature are only partially known Therefore experts were consulted in addition to literature survey.

What results have been obtained?

  • At a certain water temperature, upstream migrating Atlantic salmon will stop its migration and high water temperature (>20°C) may reduce the upstream migration of Atlantic salmon. Atlantic salmon in the Rhine is reported to reduce markedly the upstream migration above 23°C. The migration stops above 24-25°C. This can be seen as an indication for stress (Fischwerk and AquaPlus, 2011, ICPR, 2009b, Jurjens, 2006). "What one knows, from 22° C onwards the Atlantic salmon stop its migration" (Salmon expert interviewed by Boelscher). In this study we take two water temperature thresholds:
    • 23°C as the threshold for upstream migration;
    • 28°C as lethal water temperature.

Table, results of expert threshold definition and potential impact projection.
water use practice Objectives Practice threshold Critical situation Threshold crossing
Reintroduction of salmon A sustainable salmon population Significant reduction of up-river migration Extended periods with water temperature higher than 23 °C. Significant risk with higher climate change scenarios after 2050.
Inland navigation between Duisburg and Rotterdam Maintaining reliable inland shipping service along the river section. Lack of draft for ships to sail, even with lowest freights Water depth in the fairway below 2.1 m at Lobith during periods = 7 days in a row every year. Higher climate change scenario models show threshold crossing at Lobith between 2070 - 2090.
Water for agriculture in Twente (the Netherlands) Enough water for all water users. In times of drought priority allocation to water users with lowest priority for agriculture. Water managers decision to stop allocation of water to farmers in several consecutive years Low flow event at Lobith of less than 800 m3/s during 10 or more days in a row, every 2 out of 3 years. Higher climate change scenario model results show threshold crossing after 2050

Reflections on this step

  • Temperature thresholds with Temperature thresholds with acceptable margins of uncertainty can be identified. The problem is that the limiting factor is not only the daily temperature, but the period (no. of days) of exceedance of a certain temperature. No research results exist on this threshold.


Details on this case study step


The table elaborates on the expert (and literature) consultation on threshold definition.
Water use Socio-political objectives Threshold values
Salmon reintroduction The 'Rhine 2020 - Programme on the sustainable development of the Rhine' was adopted in 2001 by the Rhine ministers. This program sets the goals for the environmental protection and ecological restoration of the Rhine. One of the programme's action plans is called Rhine Salmon 2020. This action plan sets the following objectives:
  • 7,000 to 21,000 upstream migration individuals per year.
  • Undisrupted migration possibilities up to Basel.
  • Salmon stocking should be self-sustaining.
  • Re-establishment of a self-sustaining, wild Atlantic salmon population in the Rhine until 2020
Salmon are vulnerable to high water temperatures. Reintroduction policies will fail when salmon ceases to migrate or dies after:
  1. short but regularly occurring periods with potentially lethal temperatures between 25°C and 33°C.
  2. Long periods with mean water temperatures higher than 23°C. In that case the time window for salmon to migrate from the sea into the Rhine system will become too small to guarantee a sustainable population.
The success of the reintroduction is monitored by measuring the number of salmon swimming upstream. A water temperature of 23°C is a meaningful threshold value for a successful policy in this field.
Inland Navigation Three different perspectives on navigational objectives exist:
  1. From an economic point of view, when river water levels force ships to reduce their load (to avoid grounding) prices per ton transported by vessel go up. A huge increase on freight prices in the IWT market is needed for rail or road transport to become competitive. So from this point of view it is difficult to identify an economic threshold.
  2. From the river management perspective, due to international Rhine agreement, Rijkwaterstaat needs to guarantee shipping lane dimensions in the river. Currently, the standard guarantees a water depth of 2.8 meters at 5% (Q5%), which means that water depth should not be less than 2.8 meters during more than 20-16 days per year.
  3. From a physical point of view, vessels' propellers require a minimum water depth in the fairway to perform.
In this study, the threshold value is related to the minimum water depth required for ships to navigate (3rd perspective). Rhine ships require a minimum water depth for navigation between 1.7 and 2.1 m. Water depths in that range occur at water discharges in the range of 611 - 754 m3/s at Lobith gauging station. It was established (through interviews) that most of the industries depending on inland shipping along the Rhine can cope with a lapse in deliveries of less than 7 to 10 days. Longer periods will cause serious damages.
Agricultural water supply in Eastern Netherlands Allocation of water to agriculture in the growing season in the Netherlands becomes a problem when the Rhine discharge at Lobith is below 1200 - 1400 m3/s. When discharges are below this level a legal priority scheme is used as basis for decisions on water allocation. These decision are made by a national government committee. Agriculture has the lowest priority (under functions like drinking and cooling water, and stability of dikes and water deficit vulnerable nature areas). In the studied area regional authorities apply a comparable priority policy to make allocation decisions on the water they receive from the national river system. The Twente regional water distribution committee cuts agriculture off water allocation when intake of water at the Eefde pumping station is impossible due to low water levels in the river. This occurs at a Lobith Rhine discharge of 815 m3/s.

Interviews with authorities and farmers organisations revealed that one dry period may generate severe economic losses but does not constitute a threshold. Only when such dry periods occur at a certain frequency a threshold is crossed. Experts indicated the occurrence of discharges lower than 815 m3/s at Lobith with a frequency of once every 2 years or 2 consecutive years as such a threshold.


Figure 5 shows how threshold crossing points are identified. A critical situation (the horizontal grey line) indicates at what point a certain practice will fail. To illustrate uncertainties in the definition of a critical situation the grey line has a certain width. The trend lines represent the outcomes of hydrological or temperature models forced by different climate models and scenarios, usually in terms of the frequency (or length) that describe a critical situation. In reality the frequency of a heat wave or a low water event will seldom show a linear trend, but to keep the diagram simple the trends are assumed to be linear here.

As both critical situation and trend lines show variety due to uncertainties, the diagram does not identify a mathematical point, but a timespan of possible points in time (the gradient from white to red in the diagram) when a turning point may be reached.


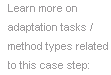
Figure 5: conceptual representation of identification of threshold crossing.