Extreme
Hitliste der Tage mit dem meißten Störmeldungen und die dazugehörigen Muster
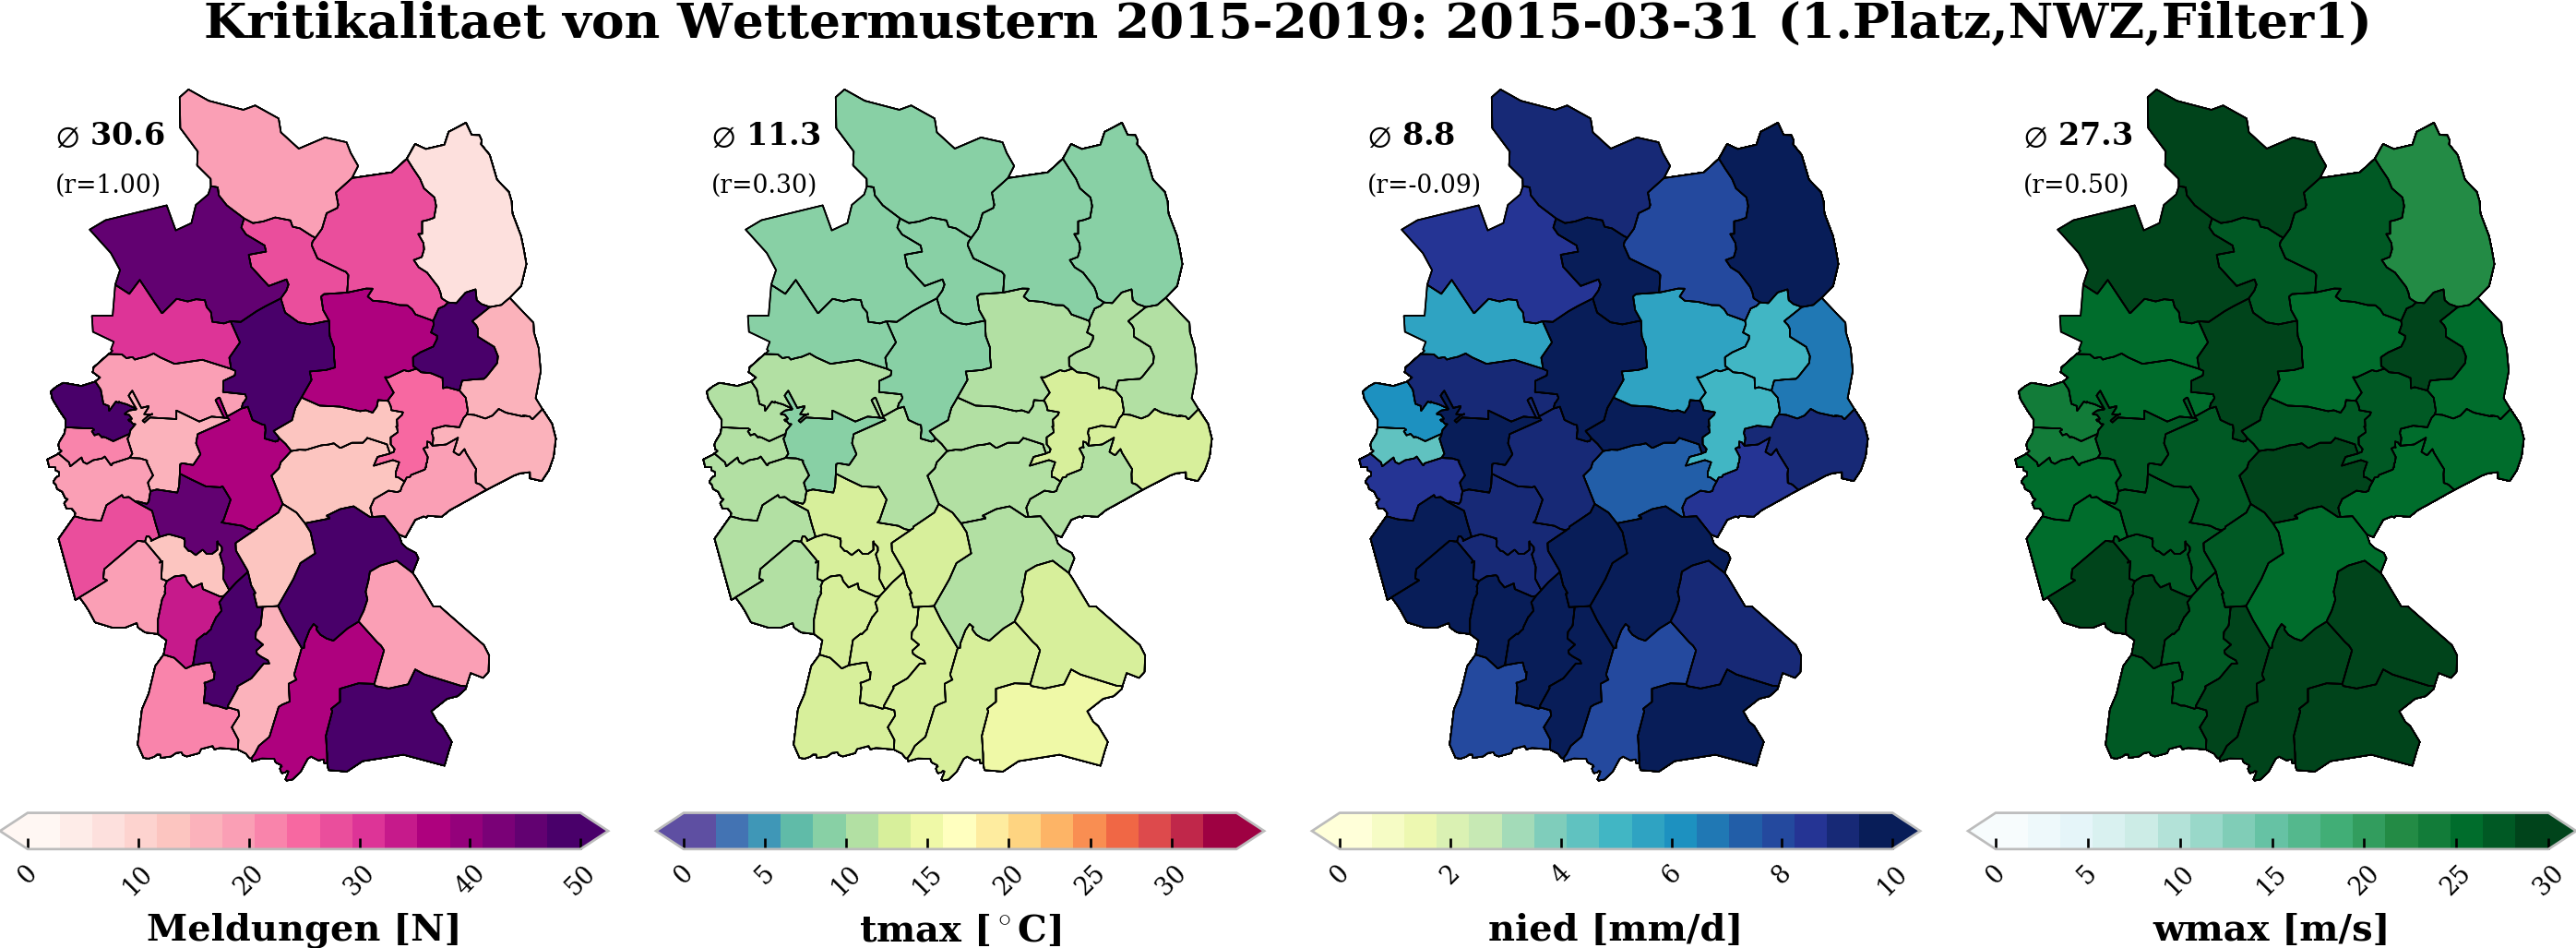
1.Platz
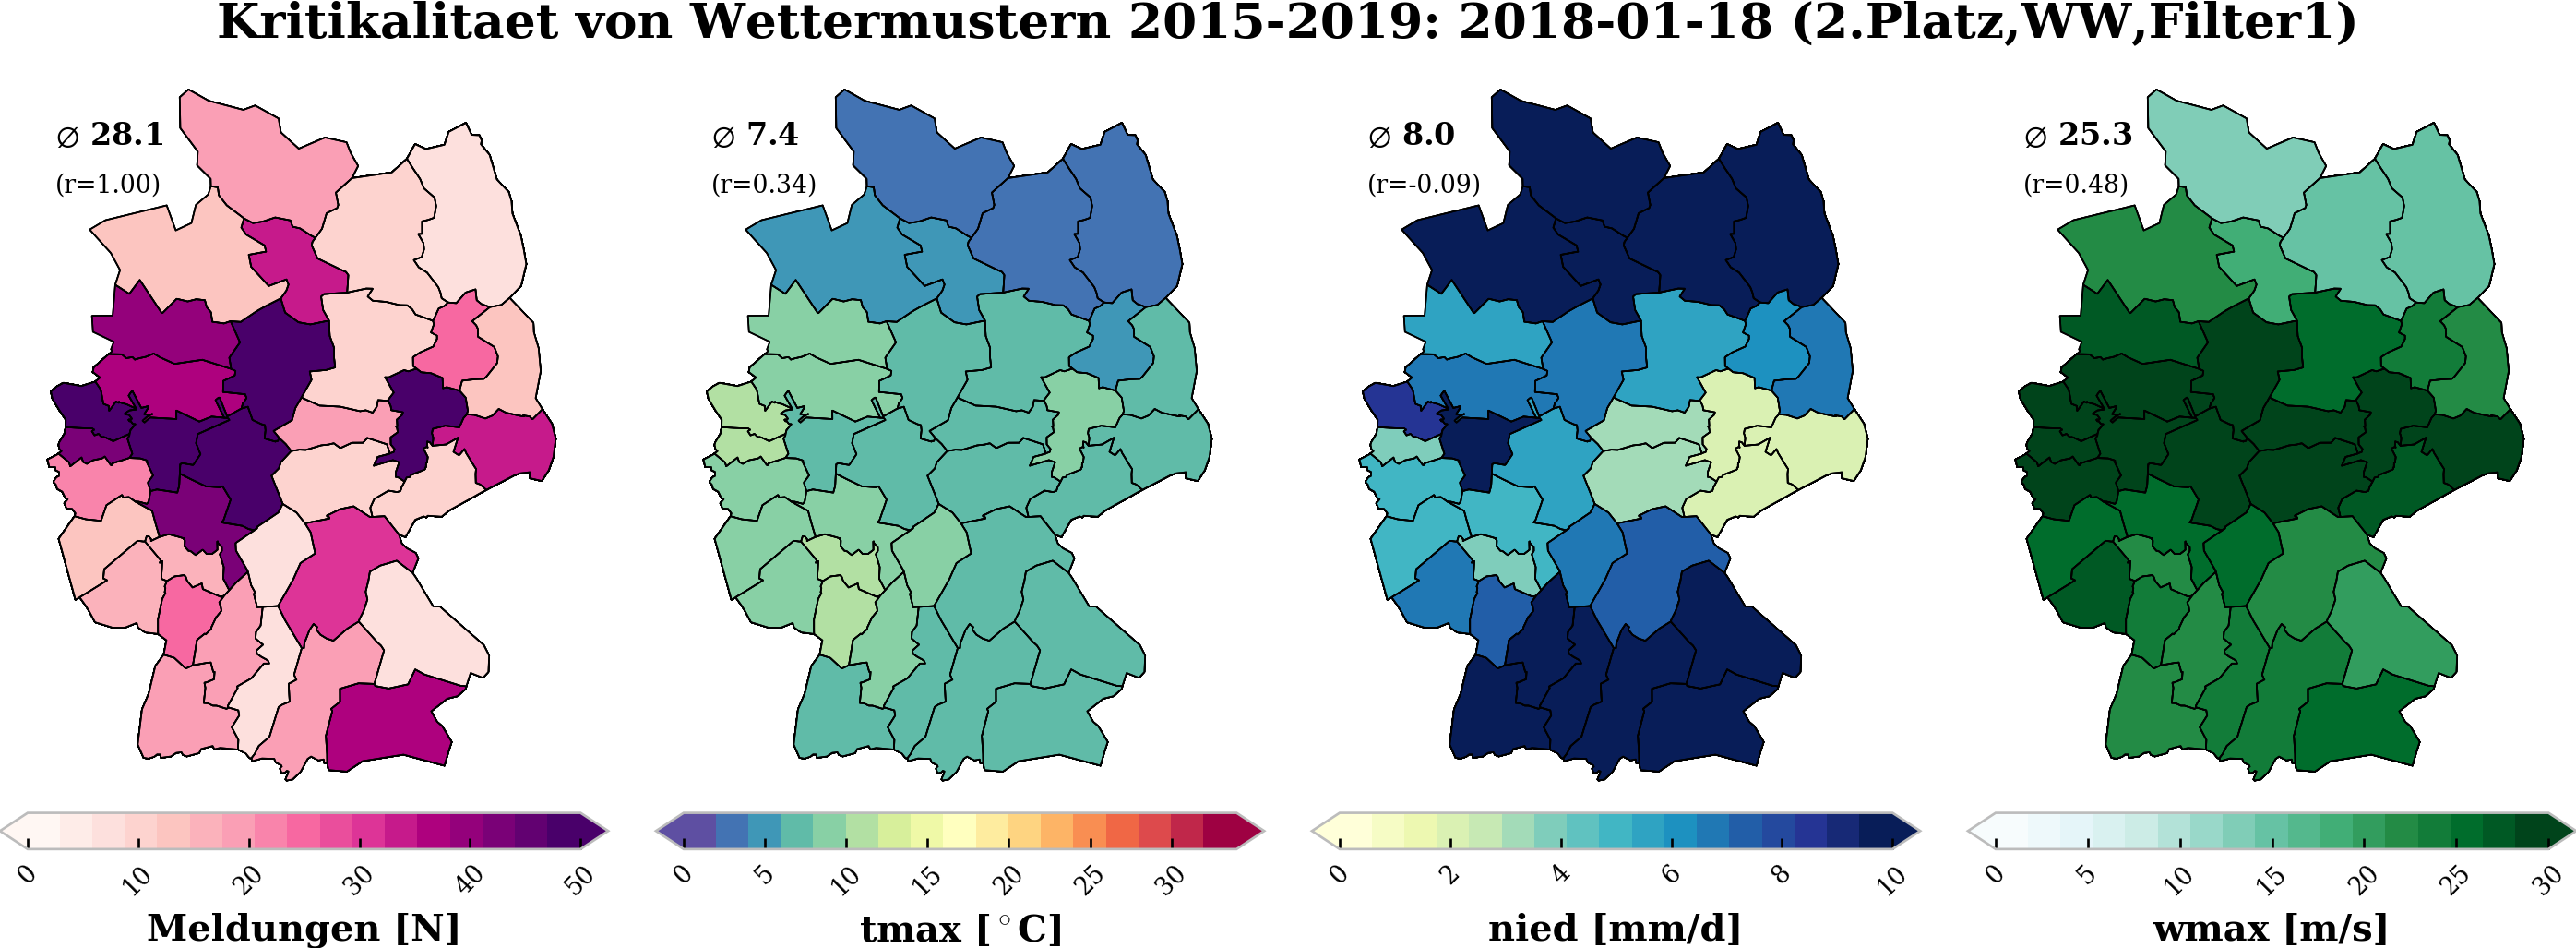
2.Platz
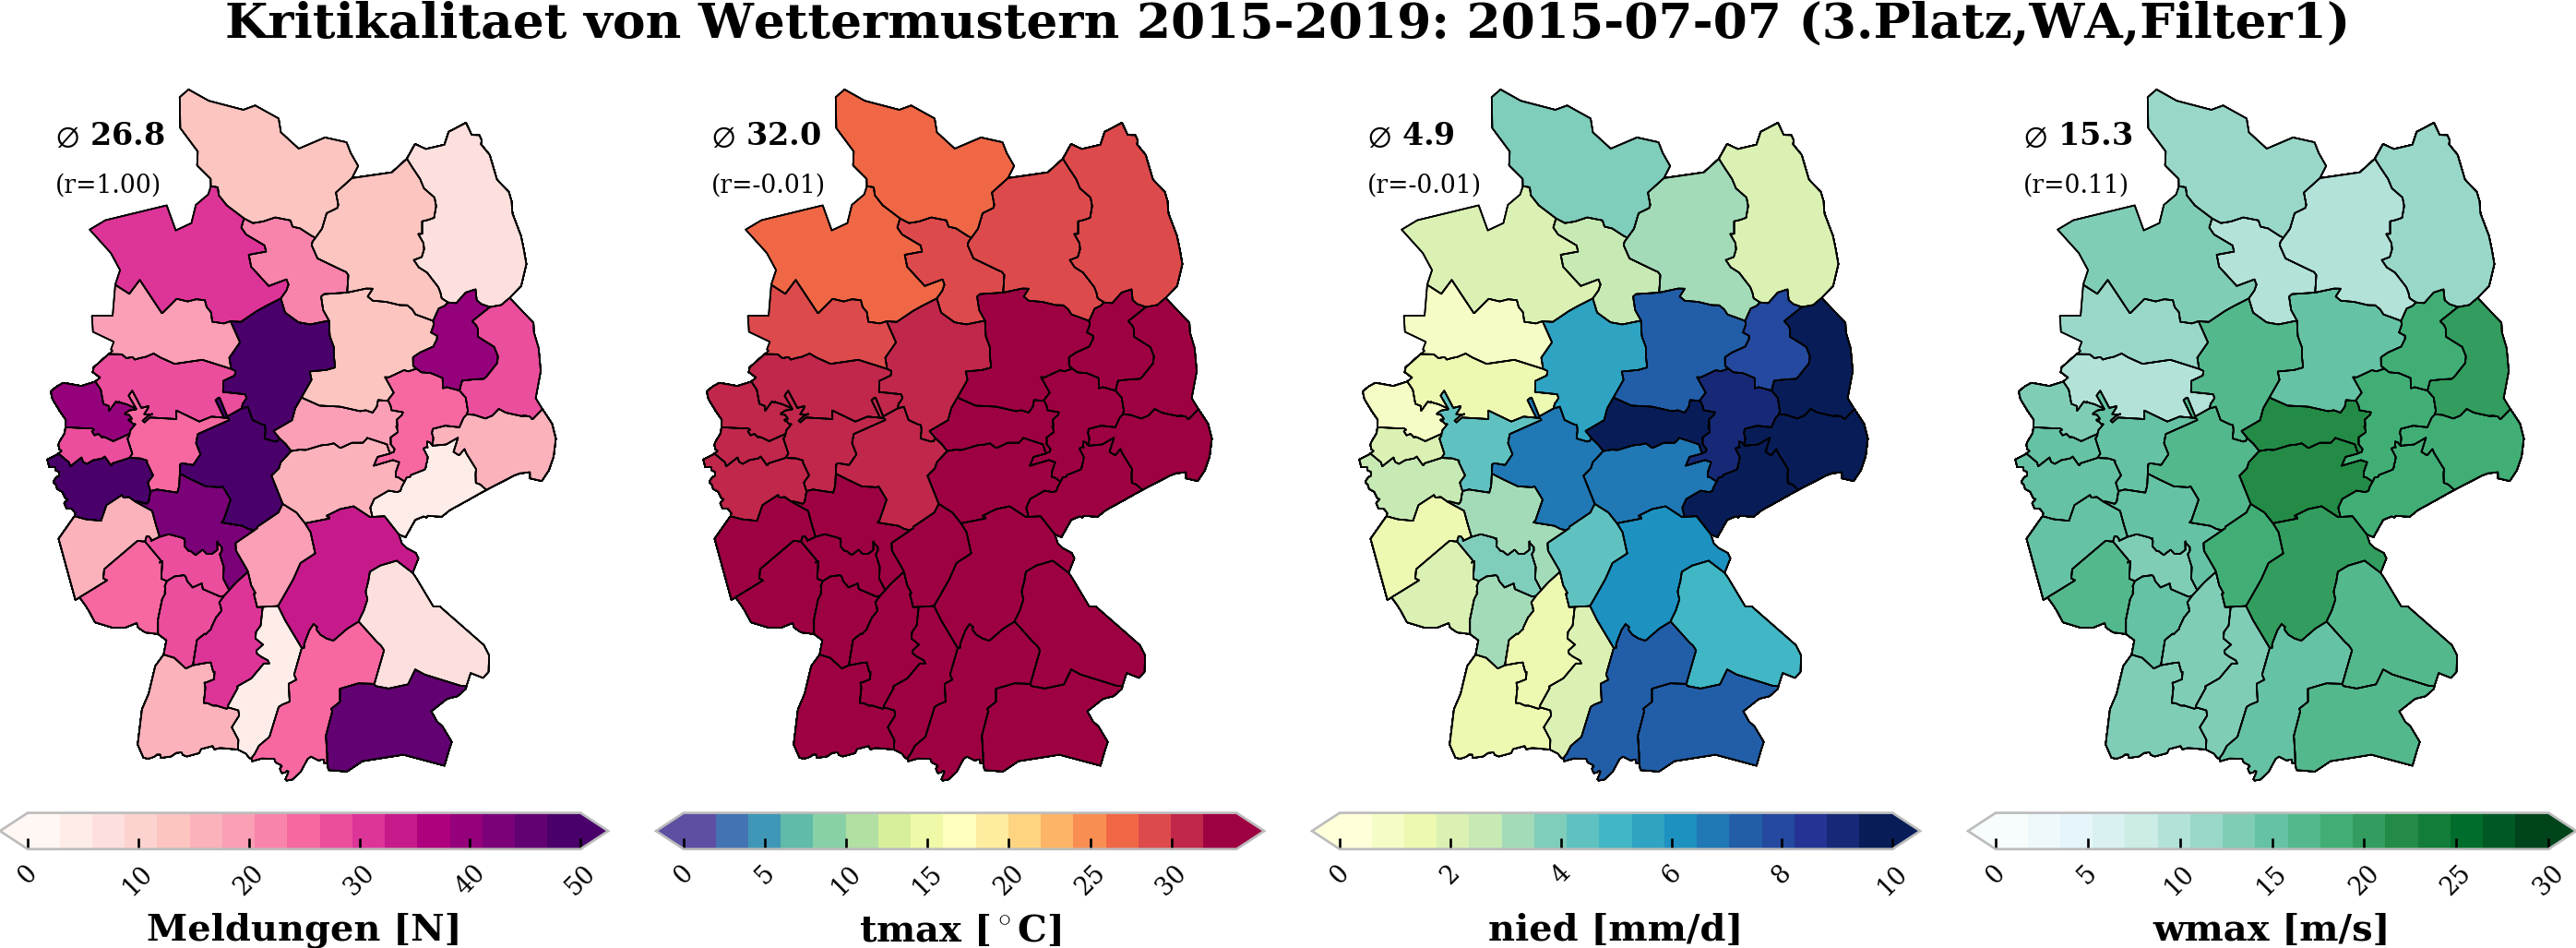
3.Platz
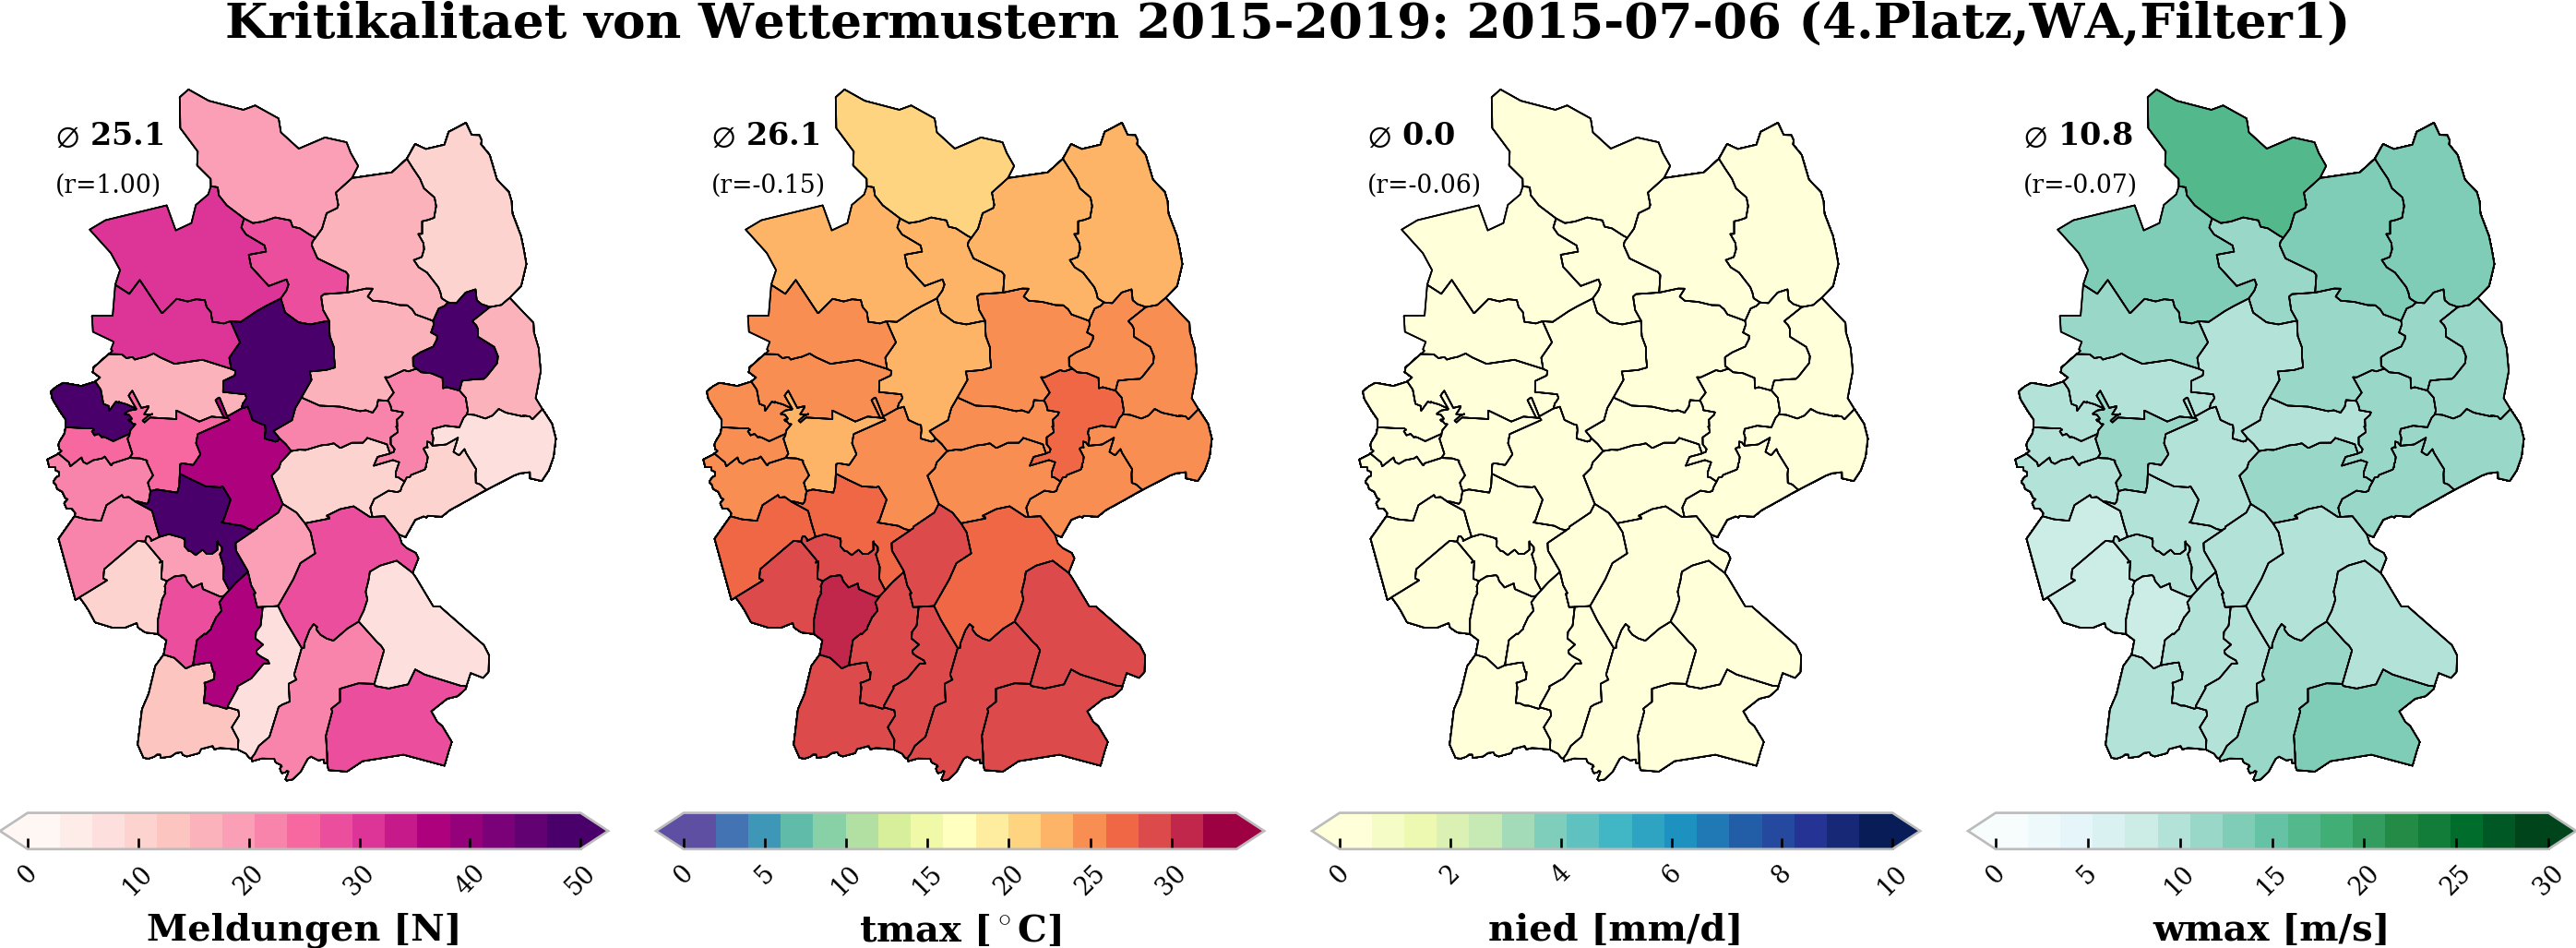
4.Platz
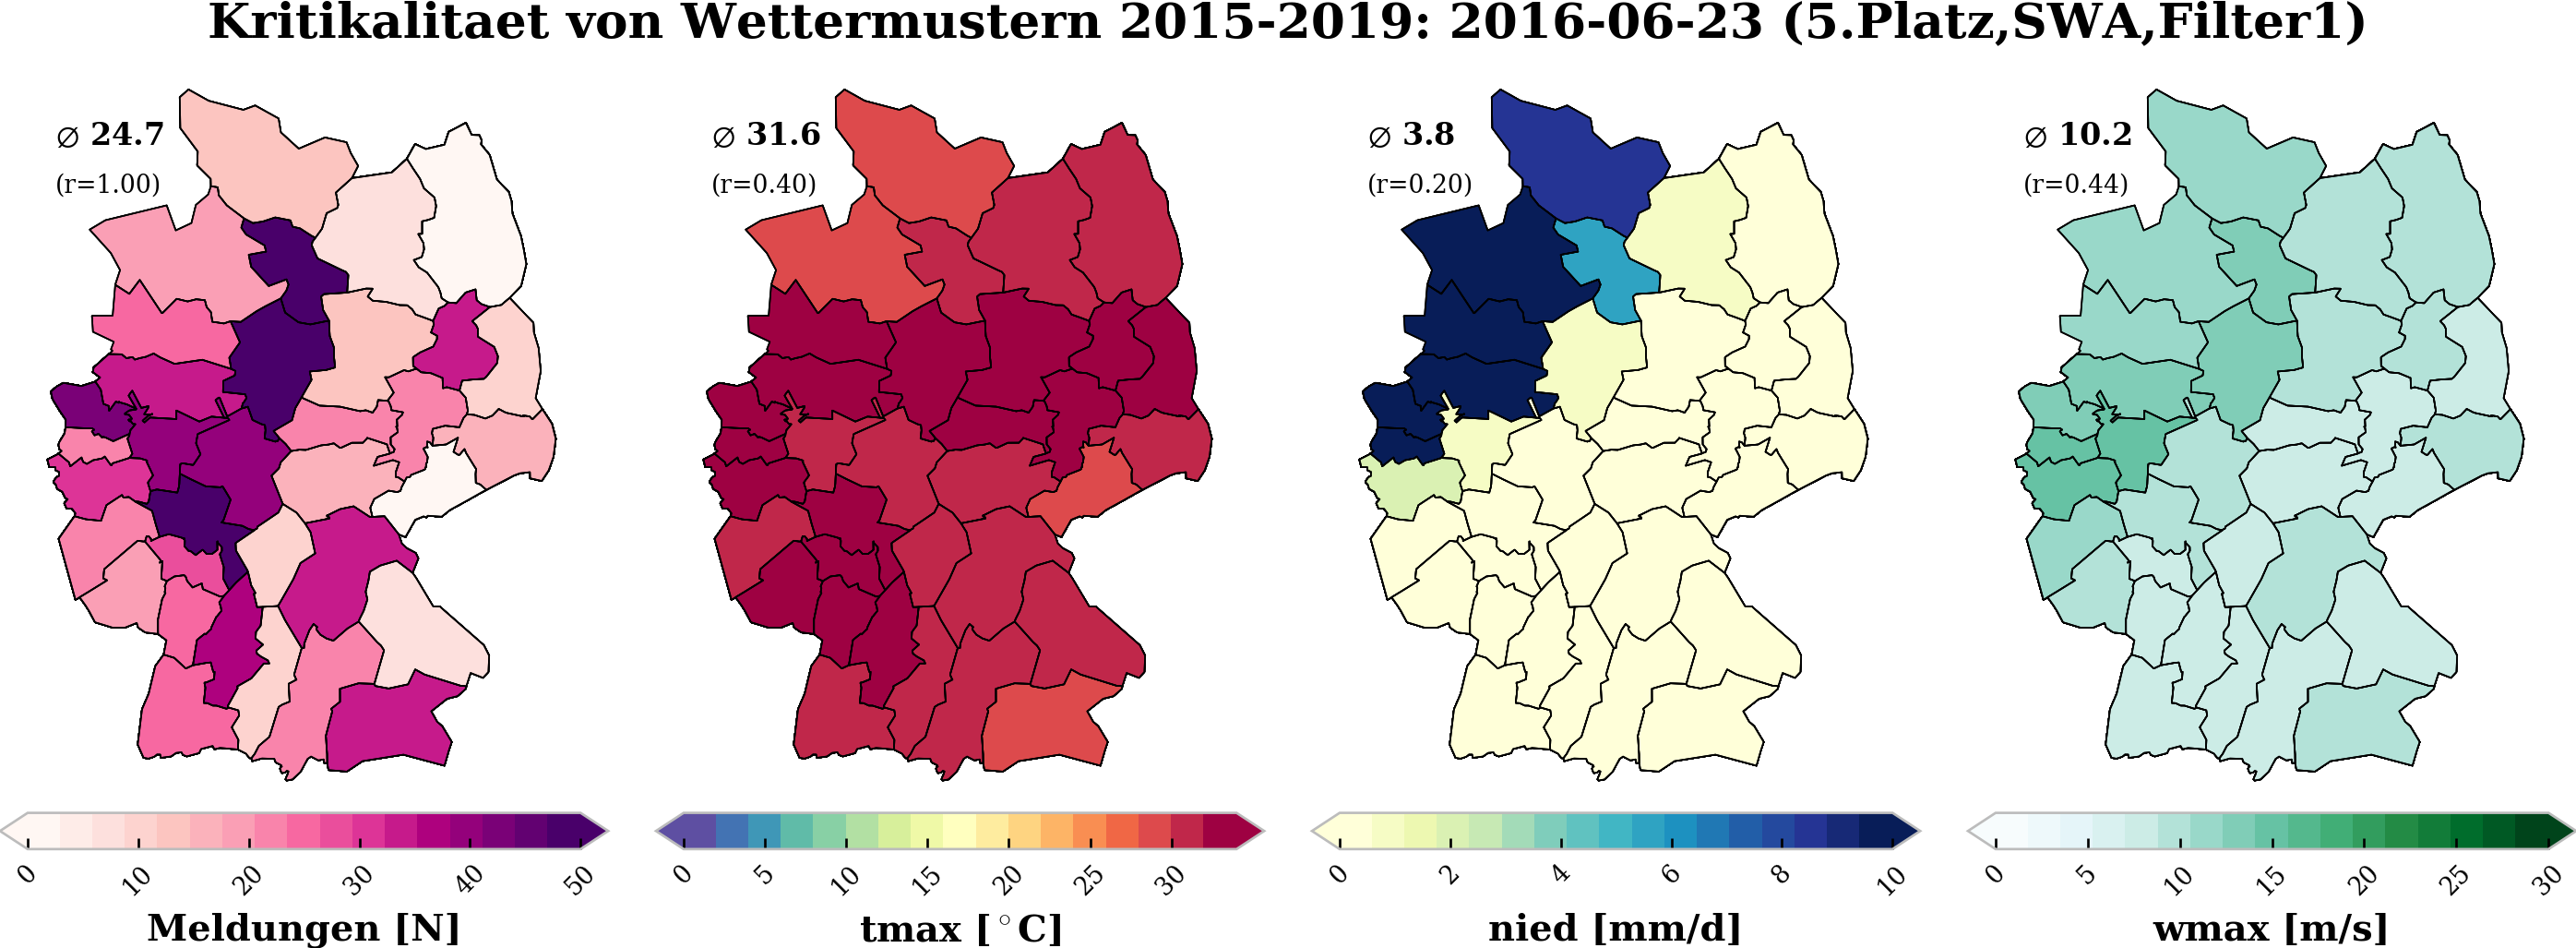
5.Platz
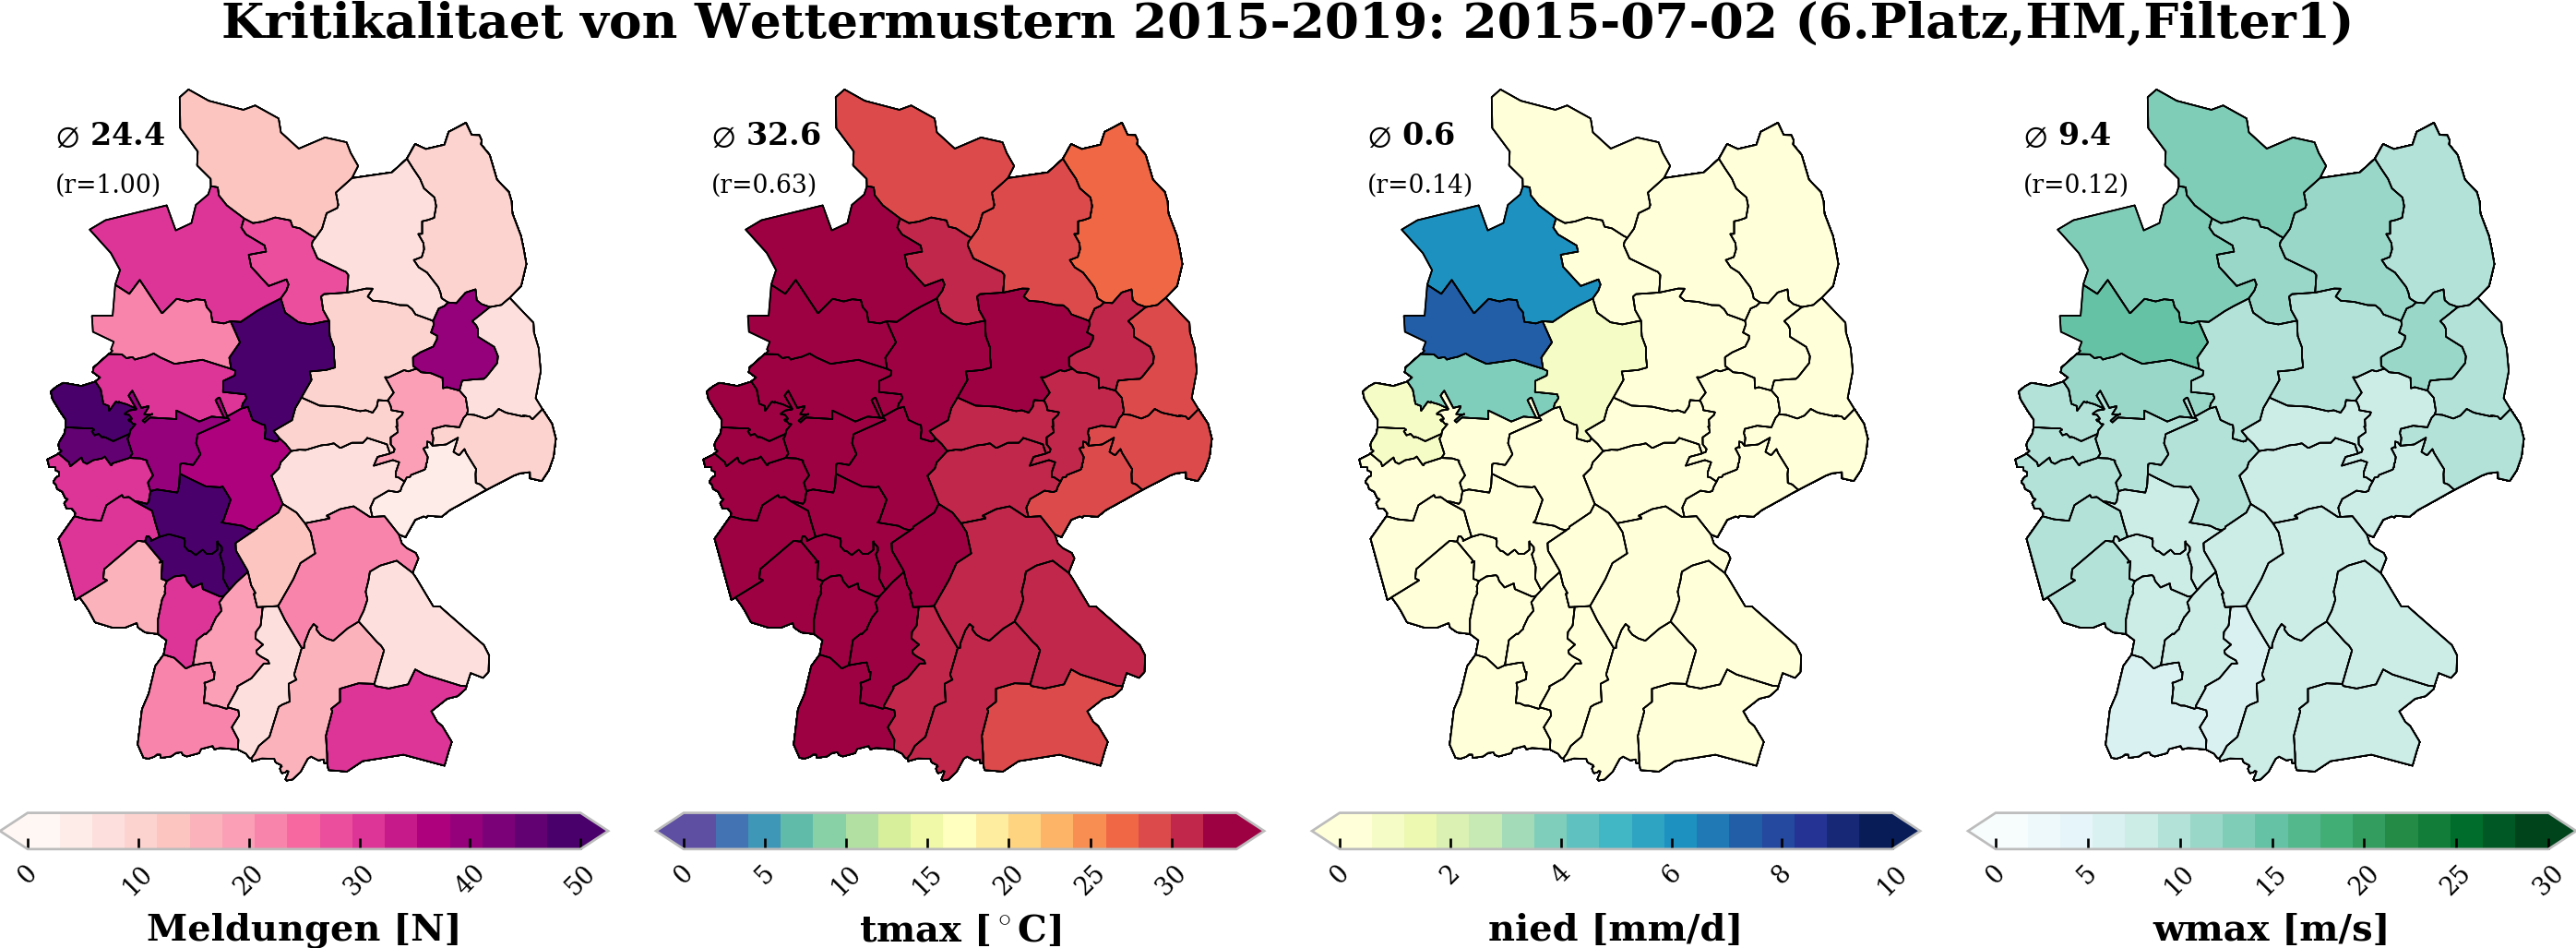
6.Platz
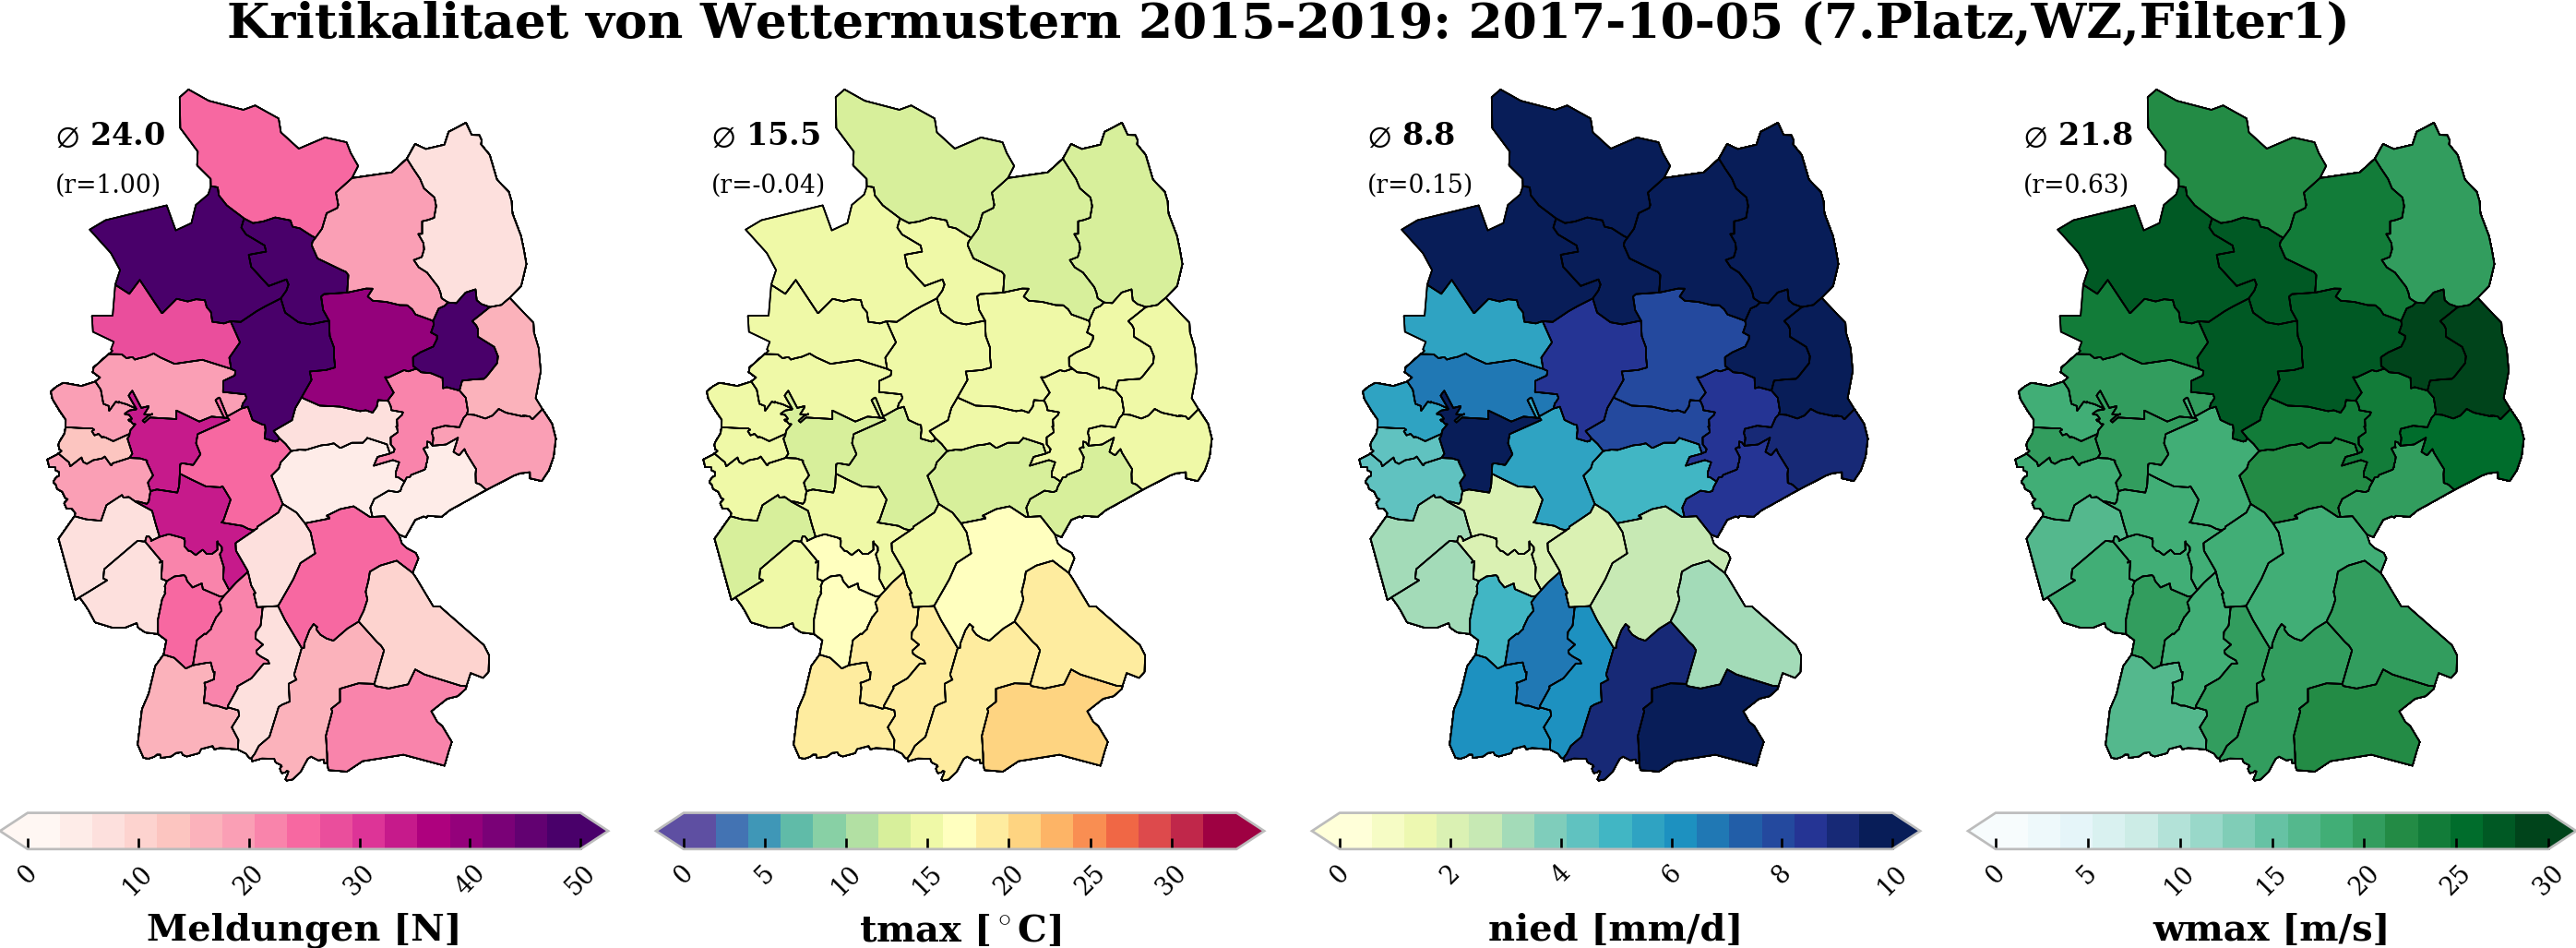
7.Platz
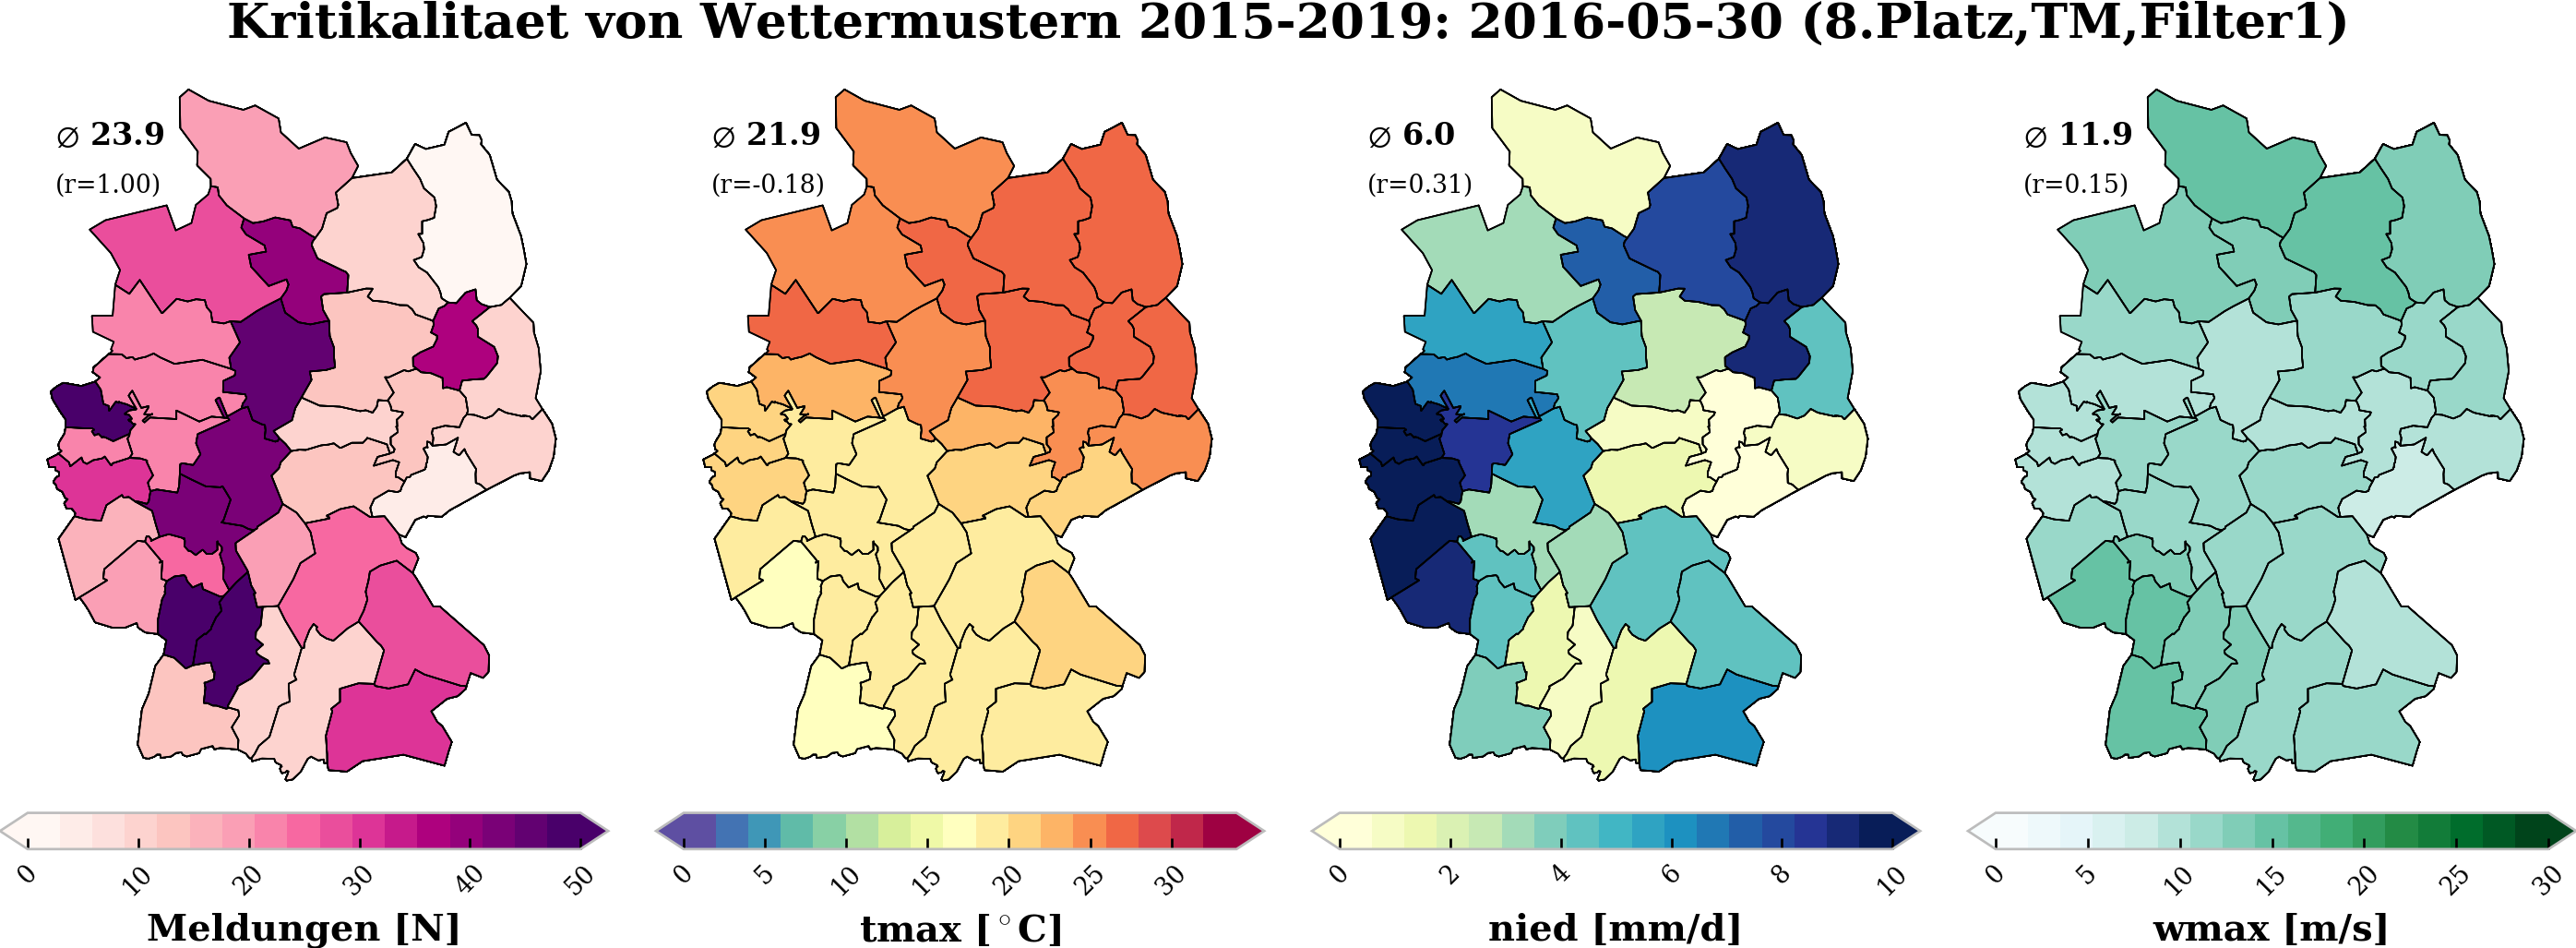
8.Platz
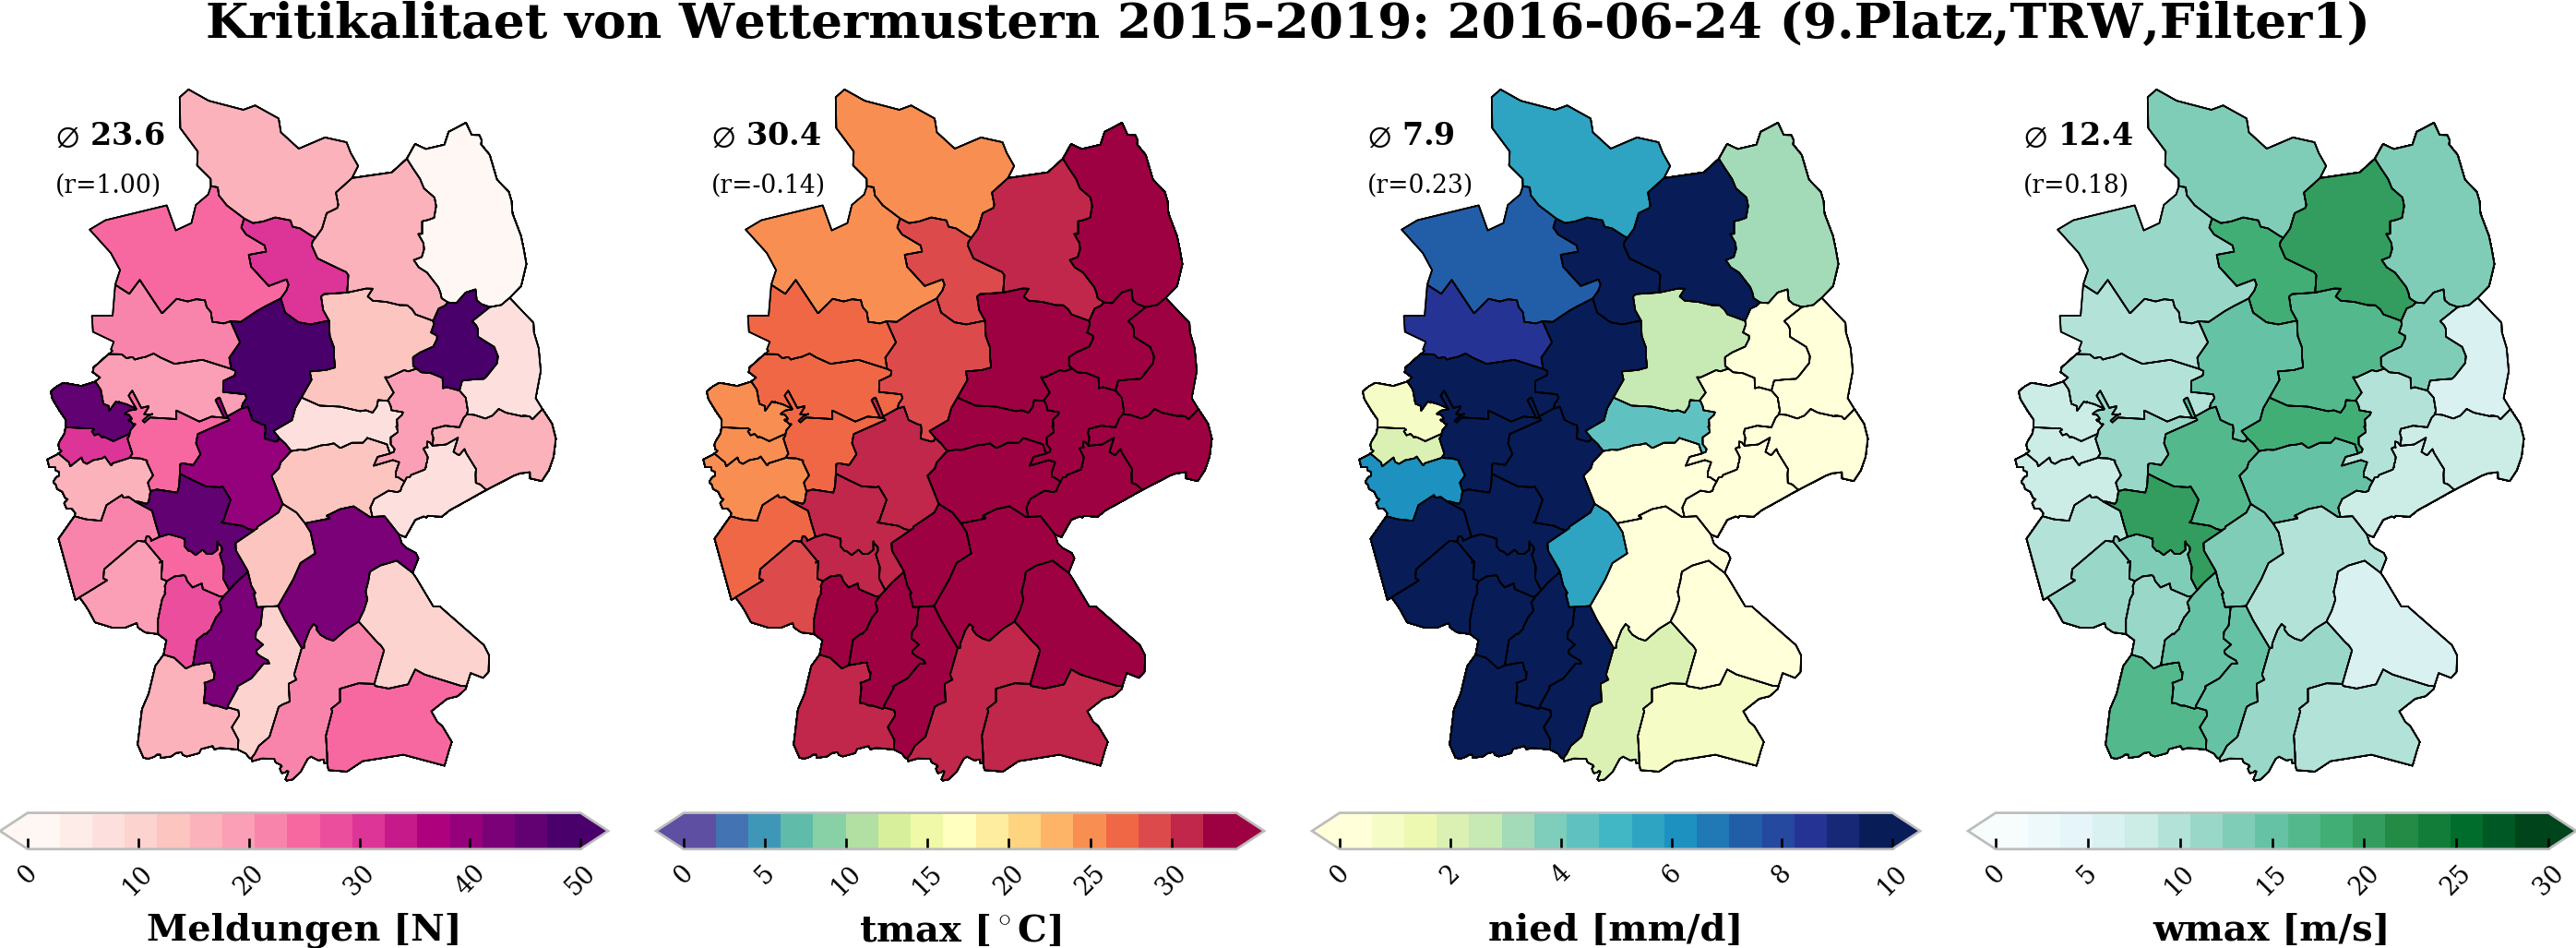
9.Platz
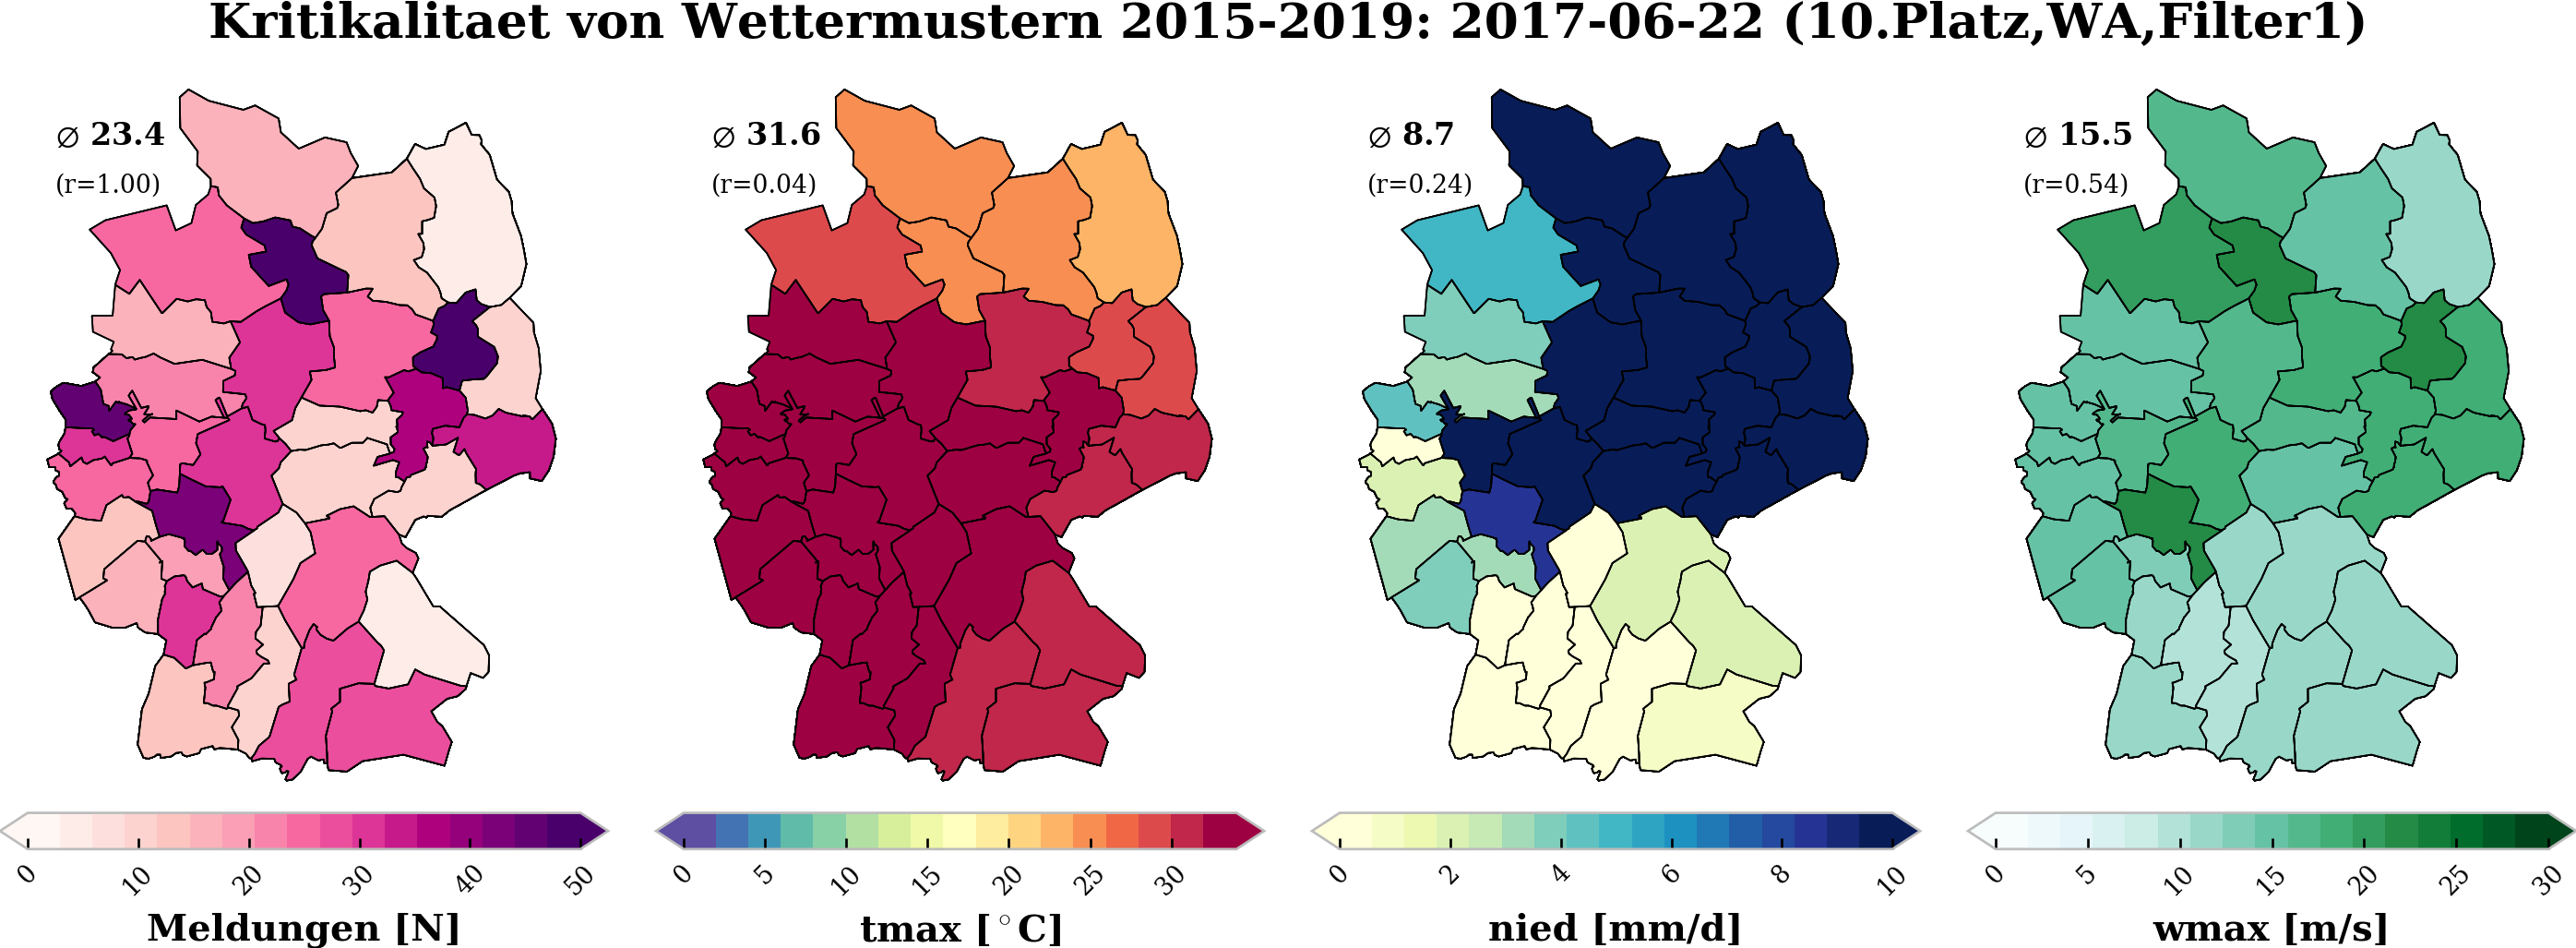
10.Platz
Code
how to run: rundoc run map.md --single-session python
Module
import sys
import numpy as N
import shapefile
import scipy.stats as stats
import pylab as P
from matplotlib.collections import PatchCollection
from pylab import Polygon
from mpl_toolkits.basemap import Basemap

P.style.use('bmh')

params = {'legend.fontsize': 8,'font.family': 'serif'}
P.rcParams.update(params)
Reading
tmp=N.genfromtxt('../shp/GP.csv',names=True,comments='#',delimiter=';',dtype=None,encoding='utf-8')

pds = tmp['Name']

file = '../dat/gwlneudatum.dat'

dd=N.genfromtxt(file,usecols=(0),skip_header=0,dtype="I")
mm=N.genfromtxt(file,usecols=(1),skip_header=0,dtype="I")
jj=N.genfromtxt(file,usecols=(2),skip_header=0,dtype="I")
gw=N.genfromtxt(file,usecols=(3),skip_header=0,dtype="S")

id = N.where((jj>=2015)&(jj<=2019))[0]

dd = dd[id]
mm = mm[id]
jj = jj[id]
gw = gw[id]
Processing
filter = 'Filter1'

uas = []

m = Basemap(projection='merc',llcrnrlat=47,urcrnrlat=55.2,llcrnrlon=5,urcrnrlon=16,resolution='l')
m.readshapefile('../shp/OSS_M1_PROD_DURCH_FL_EXT_geo', 'pds',zorder=10)

for info, shape in zip(m.pds_info, m.pds):

    pd = info['NAME']

    file = '../csv/pds-uas/'+pd+'.csv'
    data=N.genfromtxt(file,names=True,comments='#',delimiter=';',dtype=None,encoding='utf-8')
    id = N.where((data['ja']>=2015)&(data['ja']<=2019))[0]

    #dum = data['alle'][id]

    dum = []

    #for ua in ['UA32','UA04','UA57','UA44','UA38','UA35','UA29']:
    for ua in [filter]:

        dum.append(data[ua][id])

    dum = N.array(dum)

    uas.append(dum)

uas = N.array(uas)
uas = N.sum(N.sum(uas,0),0)
iua = N.argsort(uas)
iua = iua[::-1]
Plotting
paras = {'bahn':[0,50,'RdPu',r'[N]'],'tmax':[0,34,'Spectral_r',r'[$^\circ$C]'],'nied':[0,10,'YlGnBu','[mm/d]'],'wmax':[0,30,'BuGn','[m/s]']}

for j in [0,1,2,3,4,5,6,7,8,9]:

        fig = P.figure(figsize=(12,4))

        i = 0

        bahn = []
        tmax = []
        nied = []
        wmax = []

        for para in ['bahn','tmax','nied','wmax']:

            i = i+1

            ax = fig.add_subplot(1,4,i)

            m = Basemap(projection='merc',llcrnrlat=47,urcrnrlat=55.2,llcrnrlon=5,urcrnrlon=16,resolution='l')
            m.readshapefile('../shp/OSS_M1_PROD_DURCH_FL_EXT_geo', 'pds',zorder=10)

            cmap=P.get_cmap(paras[para][2],17)
            norm=P.Normalize(paras[para][0],paras[para][1])

            patches   = []
            avg = []

            for info, shape in zip(m.pds_info, m.pds):

                    pd = info['NAME']

                    if(para!='bahn'):

                        file = '../csv/obs-dwd/'+pd+'.csv'
                        data=N.genfromtxt(file,names=True,comments='#',delimiter=';',dtype=None,encoding='utf-8')
                        id = N.where((data['ja']>=2015)&(data['ja']<=2019))[0]

                        dum = data[para][id]
                        tmp = dum[iua[j]]
                        avg.append(tmp)

                    else:

                        file = '../csv/pds-uas/'+pd+'.csv'

                        data=N.genfromtxt(file,names=True,comments='#',delimiter=';',dtype=None,encoding='utf-8')
                        id = N.where((data['ja']>=2015)&(data['ja']<=2019))[0]


                        #dum = []

                        #for ua in ['UA32','UA04','UA57','UA44','UA38','UA35','UA29']:

                        #    xxx = data[ua][id]
                        #    dum.append(xxx[iua[j]])

                        #dum = N.array(dum)

                        xxx = data[filter][id]
                        dum = xxx[iua[j]]

                        tmp = N.sum(dum)

                        avg.append(tmp)

                    if(para=='bahn'): bahn.append(tmp)
                    if(para=='tmax'): tmax.append(tmp)
                    if(para=='nied'): nied.append(tmp)
                    if(para=='wmax'): wmax.append(tmp)

                    color=cmap(norm(tmp))

                    patches.append( Polygon(N.array(shape), True, color=color) )

                    pc = PatchCollection(patches, match_original=True, edgecolor='k', linewidths=0.1, zorder=2)#, alpha=0.5)

                    ax.add_collection(pc)

            if(para=='bahn'): bahn = N.array(bahn,float)
            if(para=='tmax'): tmax = N.array(tmax,float)
            if(para=='nied'): nied = N.array(nied,float)
            if(para=='wmax'): wmax = N.array(wmax,float)

            ax.axis('off')

            Nshp=10

            CM = P.scatter(N.zeros(Nshp),N.zeros(Nshp),s=N.zeros(Nshp),c=N.zeros(Nshp),cmap=cmap,vmin=paras[para][0],vmax=paras[para][1])
            CB = m.colorbar(CM,location='bottom',extend='both',shrink=0.9,pad=0.05)

            if(para=='bahn'):

                CB.set_label('Meldungen '+paras[para][3],fontsize=12,weight='bold')

            else:

                CB.set_label(para+' '+paras[para][3],fontsize=12,weight='bold')

            CB.ax.tick_params(labelsize=8,labelrotation=45)#,ha="center")#CB.ax.set_xticklabels(fontsize=10,rotation =45,ha="center")

            avg = N.array(avg)
            x,y = m(6,54.5)
            P.text(x,y,r'$\varnothing$ %.1f'%N.mean(avg),fontsize=10,weight='bold')

            if(para=='bahn'): anz = N.sum(avg); avg = N.corrcoef(bahn,bahn)
            if(para=='tmax'): avg = N.corrcoef(bahn,tmax); rtx = avg[0,1]
            if(para=='nied'): avg = N.corrcoef(bahn,nied); rrx = avg[0,1]
            if(para=='wmax'): avg = N.corrcoef(bahn,wmax); rwx = avg[0,1]

            x,y = m(6,54.0)
            P.text(x,y,r'(r=%.2f)'%avg[0,1],fontsize=8)

        fig.suptitle('Kritikalitaet von Wettermustern 2015-2019: %04i-%02i-%02i (%i.Platz,%s,%s)'%(jj[iua[j]],mm[iua[j]],dd[iua[j]],j+1,gw[iua[j]],filter),fontsize=16,weight='bold',y=1.05)

        fig.tight_layout()
        fig.savefig('./img/%02i_%s.png'%(j+1,filter),dpi=240,transparent=False,bbox_inches='tight',pad_inches=0.0)