Decision
Decision Tree
Amman: >30mm/d (1982-2021)
Step 1: categorization
| MON | SSTA | T850A | GWL | RAIN |
|---|---|---|---|---|
| Jan | cold | warm | WZ | Y |
| Feb | warm | cold | HM | N |
| Mar | hot | icy | TRM | — |
| ⁞ | — | — | ⁞ | — |
Step 2: Decision Tree, random, training ⅔, testing ⅓
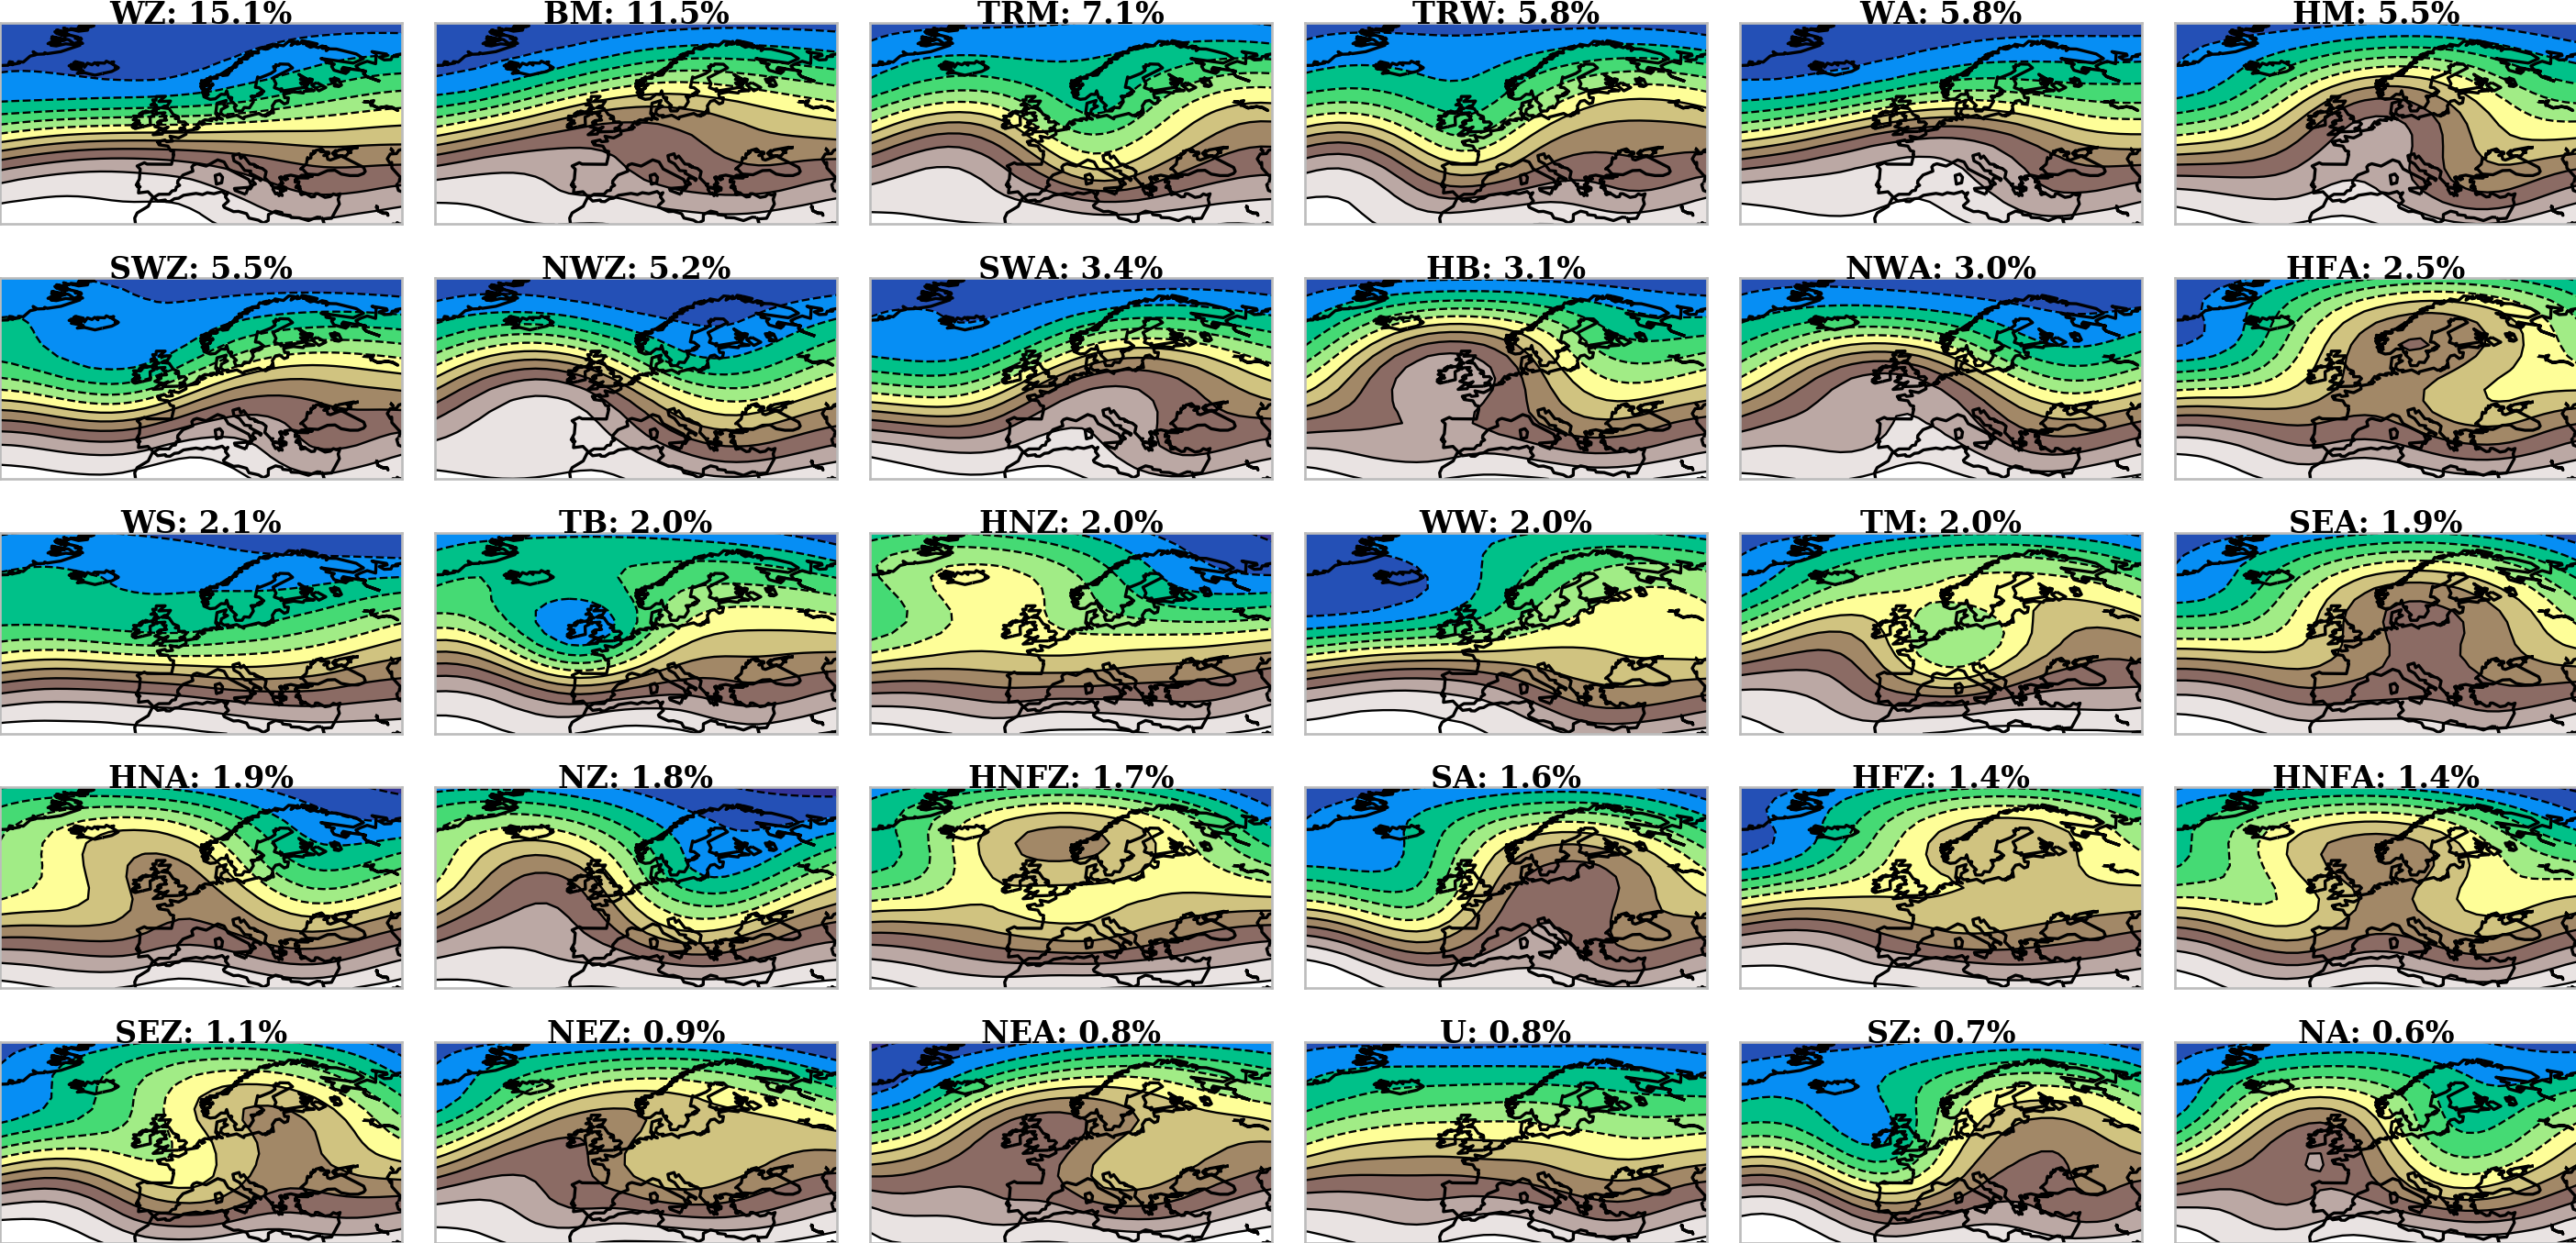
Figure: Existing Classification of European Weather-Types after Hess/Breszowsky.

Figure:| —|— upper left:|Monthly distribution of heavy rainfall events >30 mm/d in Amman. upper center:|Distribution of heavy rainfall events in Amman dependent on SST anomalies: cold|warm|hot. upper right:|Distribution of heavy rainfall events in Amman dependent on T850 anomalies: warm|cold|icy. upper right:|Distribution of heavy rainfall events in Amman dependent on European Weather-Types: WZ|HM|TRM.
Decision Tree
graph LR
  A[MONTH<sub>t</sub>] --> B[SSTA<sub>t</sub>] --> C[T850A<sub>t</sub>] --> D[GWL<sub>t-3</sub>] --> D[GWL<sub>t</sub>] --> F[RAIN<sub>t</sub>];
Code
Importing
import sys
import os
import matplotlib
matplotlib.use('Agg') # Must be before importing matplotlib.pyplot or pylab!
import matplotlib.pyplot as plt
import matplotlib.pyplot as P
from mpl_toolkits.basemap import Basemap,shiftgrid,maskoceans
from matplotlib.path import Path
from matplotlib.patches import PathPatch
import shapefile
#from netCDF4 import Dataset
import numpy as N
from netCDF4 import Dataset, num2date,date2num
import datetime
from scipy import signal,stats
import matplotlib.colors as colors
#from datetime import datetime
from matplotlib.offsetbox import AnchoredText
#from scipy.interpolate import griddata
#import scipy
import matplotlib as mpl
import pandas as pd
from sklearn.tree import DecisionTreeClassifier # Import Decision Tree Classifier
from sklearn.model_selection import train_test_split # Import train_test_split function
from sklearn import metrics #Import scikit-learn metrics module for accuracy calculation
from sklearn import tree


plt.style.use('seaborn-talk')

params = {      'legend.fontsize': 8,\
                'font.family': 'serif',\
                }
plt.rcParams.update(params)

def ma(a,n=3):
    ret=N.cumsum(a,dtype=float)
    ret[n:]=ret[n:]-ret[:-n]
    return ret[n-1:]/n
Reading
city = {

   'Amman':[35.930359,31.963158],
   'Aqaba':[35.00778,29.52667],
   'WadiMusa':[35.480125,30.321635],
}

ort = 'Amman'
#ort = 'Aqaba'

jo = N.arange(1981,2022,1);nj = len(jo)
mo = N.arange(1,13,1);nm = len(mo)
mon = ['Jan','Feb','Mar','Apr','May','Jun','Jul','Aug','Sep','Oct','Nov','Dec']

file = '../../data/gwl/gwlneudatum.dat'
dd = N.genfromtxt(file,usecols=(0),skip_header=1,dtype='i')
mm = N.genfromtxt(file,usecols=(1),skip_header=1,dtype='i')
jj = N.genfromtxt(file,usecols=(2),skip_header=1,dtype='i')
gw = N.genfromtxt(file,usecols=(3),skip_header=1,dtype='str')

id = N.where((jj>=1982)&(jj<=2021))[0]#&((mm==9)|(mm==10)|(mm==11)|(mm==12)|(mm==1)|(mm==2)|(mm==3)|(mm==4)))[0]

gw = gw[id]

gw[gw=='U'] = 'WZ'
gw[gw=='WW'] = 'WZ'
gw[gw=='WA'] = 'WZ'
#gw[gw=='WS'] = 'WZ'


gw[gw=='TRW'] = 'SWZ'
#gw[gw=='SZ'] = 'SWZ'

gw[gw=='TM'] = 'TRM'

gw[gw=='HB'] = 'NWA'

gw[gw=='SA'] = 'S'
gw[gw=='SZ'] = 'S'

gw[gw=='NA'] = 'N'
gw[gw=='NZ'] = 'N'

gw[gw=='NEA'] = 'NE'
gw[gw=='NEZ'] = 'NE'

'''

gw[gw=='TM'] = 'TRM'

gw[gw=='SEA'] = 'SE'
gw[gw=='SEZ'] = 'SE'

gw[gw=='SWA'] = 'SW'
gw[gw=='SWZ'] = 'SW'

gw[gw=='HNFA'] = 'HNF'
gw[gw=='HNFZ'] = 'HNF'

gw[gw=='U'] = 'W'
gw[gw=='WA'] = 'W'
gw[gw=='WZ'] = 'W'
gw[gw=='WW'] = 'W'
gw[gw=='WS'] = 'W'

gw[gw=='NEA'] = 'NE'
gw[gw=='NEZ'] = 'NE'

gw[gw=='NWA'] = 'NW'
gw[gw=='NWZ'] = 'NW'

gw[gw=='NA'] = 'N'
gw[gw=='NZ'] = 'N'

gw[gw=='HNA'] = 'HN'
gw[gw=='HNZ'] = 'HN'

gw[gw=='HFA'] = 'HF'
gw[gw=='HFZ'] = 'HF'

gw[gw=='SA'] = 'S'
gw[gw=='SZ'] = 'S'

'''

go = N.array(list(set(gw)));ng = len(go)

print (go)

file = '../../data/ClimateExplorer/isstoiv2_daily_anom_20-35E_30-40N_n_su.dat'
#file = '../../data/ClimateExplorer/isstoiv2_daily_mean_20-35E_30-40N_n_su.dat'

dd = N.genfromtxt(file,usecols=(0),comments='#',dtype='str')
st = N.genfromtxt(file,usecols=(1),comments='#',dtype='f')

jj = []
mm = []

for d in dd:

    jj.append(int(d[0:4]))
    mm.append(int(d[4:6]))

jj = N.array(jj)
mm = N.array(mm)

id = N.where((jj>=1982)&(jj<=2021))[0]#&((mm==9)|(mm==10)|(mm==11)|(mm==12)|(mm==1)|(mm==2)|(mm==3)|(mm==4)))[0]

st = st[id]

file = '../../data/ClimateExplorer/iera5_t850_daily_20-35E_30-40N_n_su.dat'
dd = N.genfromtxt(file,usecols=(0),comments='#',dtype='str')


file = '../../data/ClimateExplorer/iera5_t850_daily_20-35E_30-40N_n_su_a.txt'
#dd = N.genfromtxt(file,usecols=(0),comments='#',dtype='str')
tp = N.genfromtxt(file,usecols=(1),comments='#',dtype='f')

jj = []
mm = []

for d in dd:

    jj.append(int(d[0:4]))
    mm.append(int(d[4:6]))

jj = N.array(jj)
mm = N.array(mm)

id = N.where((jj>=1982)&(jj<=2021))[0]#&((mm==9)|(mm==10)|(mm==11)|(mm==12)|(mm==1)|(mm==2)|(mm==3)|(mm==4)))[0]

tp = tp[id]

#file = '../../data/ClimateExplorer/v2p0chirps_25_34-40E_29-34N.cdf'
#file = '../../data/ClimateExplorer/era5_tp_daily_af_34-40E_29-34N_su.cdf'
file = '../../data/ClimateExplorer/pr_W5E5v2.0_19810101-20191231.cdf'

nc = Dataset(file,'r')
lon = N.array(nc.variables['lon'][:])
lat = N.array(nc.variables['lat'][:])
dat = N.array(nc.variables['tp'][:])
tim = nc.variables['time']

tim = num2date(tim[:],units=tim.units,calendar=tim.calendar)

jj = []
mm = []
dd = []

for it in tim:

    jj.append(it.year)
    mm.append(it.month)
    dd.append(it.day)

jj = N.array(jj)
mm = N.array(mm)
dd = N.array(dd)

id = N.where((jj>=1982)&(jj<=2021))[0]#&((mm==9)|(mm==10)|(mm==11)|(mm==12)|(mm==1)|(mm==2)|(mm==3)|(mm==4)))[0]

jj = jj[id]
mm = mm[id]
dd = dd[id]

dat = dat[id,:,:]

nd = len(dd)

nc.close()
Processing
nom = {'day':[],'month':[],'year':[],'gwl':[],'sst':[],'Amman':[],'WadiMusa':[],'Aqaba':[],'t850':[]}
cat = {'mon':[],'sst':[],'t850':[],'gwl0':[],'gwl1':[],'Amman':[],'WadiMusa':[],'Aqaba':[]}

sstu = N.percentile(st,25)
ssto = N.percentile(st,75)

t850u = N.percentile(tp,25)
t850o = N.percentile(tp,75)

lo,la = N.meshgrid(lon,lat)

for d in range(3,nd):

    nom['day'].append(dd[d])
    nom['month'].append(mm[d])
    nom['year'].append(jj[d])
    nom['gwl'].append(gw[d])
    nom['sst'].append(st[d])
    nom['t850'].append(tp[d])

    cat['gwl0'].append(gw[d])
    cat['gwl1'].append(gw[d-3])
    cat['mon'].append(mon[mm[d]-1])

    if(st[d]<sstu): cat['sst'].append('cold')
    elif((st[d]>=sstu)&(st[d]<=ssto)): cat['sst'].append('warm')
    else: cat['sst'].append('hot')

    if(tp[d]<t850u): cat['t850'].append('icy')
    elif((tp[d]>=t850u)&(tp[d]<=t850o)): cat['t850'].append('cold')
    else: cat['t850'].append('warm')

    for c in city:

        distance = (lo-city[c][0])**2 + (la-city[c][1])**2
        iy,ix = N.where(distance==distance.min())

        nom[c].append(dat[d,iy[0],ix[0]])

        if(dat[d,iy[0],ix[0]]<=15): cat[c].append('N')
        else: cat[c].append('Y')

ig = []

for g in go:

    id = N.where(g==gw)[0]

    ig.append(len(id))

ig = N.array(ig)
ig = N.argsort(ig)

go = go[ig[::-1]]
Attribution
P.figure(figsize=(12,6))

k = 0

for c in city:

    k = k+1

    ax = P.subplot(1,3,k)

    tmp = N.zeros((ng,nm),float)

    for g in range(ng):
        for m in range(nm):

            id = N.where((N.array(nom['month'])==mo[m])&(N.array(nom['gwl'])==go[g]))[0]

            tmp[g,m] = N.nanmean(N.array(nom[c])[id])

    P.imshow(tmp,cmap=P.get_cmap('YlGnBu'),aspect=0.45, vmin=0, vmax=10)

    ax = plt.gca();

    # Major ticks
    ax.set_xticks(N.arange(0,12,1))
    ax.set_yticks(N.arange(0,ng,1))

    # Labels for major ticks
    ax.set_xticklabels(mon,fontsize=8)
    ax.set_yticklabels(go,fontsize=8)

    # Minor ticks
    ax.set_xticks(N.arange(-.5,12,1), minor=True)
    ax.set_yticks(N.arange(-.5,ng,1), minor=True)

    ax.grid(which='minor',color='k',linestyle='-',linewidth=1)

    P.title(c,fontsize=14,weight='bold')

P.tight_layout()

plt.savefig('./img/decision.png',dpi=240,transparent=False,bbox_inches='tight',pad_inches=0.0)
Transition
tmp = N.zeros((nm,ng,ng),float)

for d in range(1,nd):

    im = mm[d]-1
    ig = N.where(gw[d-1]==go)[0]
    jg = N.where(gw[d]==go)[0]

    tmp[im,ig,jg] = tmp[im,ig,jg] + 1

tmp = tmp/float(nj)

tmp[tmp==0] = N.nan

P.figure(figsize=(15,5))

for m in range(nm):

    ax = P.subplot(2,6,1+m)

    P.imshow(tmp[m,:,:],cmap=P.get_cmap('Spectral_r'),vmin=0, vmax=1)

    ax = plt.gca();

    # Major ticks
    ax.set_xticks(N.arange(0,ng,1))
    ax.set_yticks(N.arange(0,ng,1))

    # Labels for major ticks
    ax.set_xticklabels(go,fontsize=5,rotation=90)
    ax.set_yticklabels(go,fontsize=5)

    # Minor ticks
    ax.set_xticks(N.arange(-.5,30,1), minor=True)
    ax.set_yticks(N.arange(-.5,30,1), minor=True)

    ax.grid(which='minor',color='k',linestyle='-',linewidth=0.5)

    P.title(mon[m],fontsize=14,weight='bold')

P.tight_layout()

plt.savefig('./img/decision.png',dpi=240,transparent=False,bbox_inches='tight',pad_inches=0.0)
SST
tmp = N.zeros((nj,nm),float)

for j in range(nj):
    for m in range(nm):

        id = N.where((jj==jo[j])&(mm==mo[m]))[0]

        tmp[j,m] = N.mean(st[id])

P.figure(figsize=(15,5))

P.imshow(tmp.T,cmap=P.get_cmap('bwr'),vmin=-2,vmax=2)

ax = plt.gca();

# Major ticks
ax.set_xticks(N.arange(0,nj,1))
ax.set_yticks(N.arange(0,nm,1))

# Labels for major ticks
ax.set_xticklabels(jo,fontsize=10,rotation=90)
ax.set_yticklabels(mon,fontsize=10)

# Minor ticks
ax.set_xticks(N.arange(-.5,nj,1), minor=True)
ax.set_yticks(N.arange(-.5,nm,1), minor=True)

ax.grid(which='minor',color='k',linestyle='-',linewidth=0.5)

P.tight_layout()

plt.savefig('./img/decision.png',dpi=240,transparent=False,bbox_inches='tight',pad_inches=0.0)
Modelling
df = pd.DataFrame.from_dict(cat)

trees = DecisionTreeClassifier()
X_train,X_test,y_train,y_test = train_test_split(df[['mon','sst','t850','gwl0','gwl1']],df[ort],test_size=0.3,random_state=1)

x_train = pd.get_dummies(X_train,drop_first=True)
x_test = pd.get_dummies(X_test,drop_first=True)

clf = trees.fit(x_train,y_train)
y_pred = clf.predict(x_test)
print("Accuracy:",metrics.accuracy_score(y_test, y_pred))

print ([*x_train])

tree.export_graphviz(clf,out_file="./img/tree.dot",feature_names = [*x_train],class_names=['N','Y'],filled = True,max_depth=7,impurity=False)

y_test = N.array(y_test)
X_test = N.array(X_test)

nd = len(y_test)
do = N.arange(nd)

test = N.zeros(nd,float)
pred = N.zeros(nd,float)
both = N.zeros(nd,float)

for d in range(nd):

    if(y_test[d]=='Y'):

       test[d] = 1

       print (X_test[d])

print ('---------------')

for d in range(nd):

    if(y_pred[d]=='Y'):

       pred[d] = 1

       print (X_test[d])

print ('---------------')

for d in range(nd):

    if((y_pred[d]=='Y')&(y_test[d]=='Y')):

       print (X_test[d])

       both[d] = 1

P.figure(figsize=(14,7))

X_test = N.array(X_test)
X_train = N.array(X_train)

id = N.where(y_test=='Y')[0]
jd = N.where(y_train=='Y')[0]

P.subplot(2,3,1)

yo = []
zo = []

for x in mon:

    ij = N.where(N.array(X_test[id,0])==x)[0]
    yo.append(len(ij))

    ij = N.where(N.array(X_train[jd,0])==x)[0]
    zo.append(len(ij))

yo = N.array(yo)
zo = N.array(zo)

xo = N.arange(len(yo))

P.bar(xo,yo,width=0.8,color='g',edgecolor='k',lw=1,alpha=0.5)
#P.bar(xo,zo,width=0.8,color='g',lw=0.5,alpha=0.5)

P.xticks(xo,mon,rotation=90)
P.ylabel('Number')
P.title('Months')

P.subplot(2,3,2)

so = ['cold','warm','hot']

zo = []
yo = []

for x in so:

    ij = N.where(N.array(X_test[id,1])==x)[0]
    yo.append(len(ij))

    ij = N.where(N.array(X_train[jd,1])==x)[0]
    zo.append(len(ij))


yo = N.array(yo)
zo = N.array(zo)
xo = N.arange(len(yo))

P.bar(xo,yo,width=0.8,color='r',edgecolor='k',lw=1,alpha=0.5)
#P.bar(xo,zo,width=0.8,color='r',lw=0.5,alpha=0.5)

P.xticks(xo,so)
P.ylabel('Number')

P.title('SSTA')

P.subplot(2,3,3)

so = ['warm','cold','icy']
zo = []
yo = []

for x in so:

    ij = N.where(N.array(X_test[id,2])==x)[0]
    yo.append(len(ij))

    ij = N.where(N.array(X_train[jd,2])==x)[0]
    zo.append(len(ij))

yo = N.array(yo)
zo = N.array(zo)
xo = N.arange(len(yo))

P.bar(xo,yo,width=0.8,color='b',edgecolor='k',lw=1,alpha=0.5)
#P.bar(xo,zo,width=0.8,color='b',lw=0.5,alpha=0.5)

P.xticks(xo,so)
P.ylabel('Number')

P.title('T850A')

ax = P.subplot(2,1,2)

so = go
yo = []
zo = []

for x in so:

    ij = N.where(N.array(X_test[id,3])==x)[0]
    yo.append(len(ij))

    ij = N.where(N.array(X_train[jd,3])==x)[0]
    zo.append(len(ij))

yo = N.array(yo)
zo = N.array(zo)
xo = N.arange(len(yo))

P.bar(xo,yo,width=0.8,color='m',edgecolor='k',lw=1,alpha=0.5)
#P.bar(xo,zo,width=0.8,color='m',lw=0.5,alpha=0.5)

P.xticks(xo,so)
P.xlim(-1,ng+1)
P.ylabel('Number')

P.title('GWL')
P.xticks(rotation=90)

x = N.where(test==1)[0]
y = N.where(pred==1)[0]
z = N.where(both==1)[0]

print (len(x),len(y),len(z))

at = AnchoredText('W5E5-'+ort+': %i|%i|%i (>15mm/d)'%(len(x),len(y),len(z)),prop=dict(size=18,weight='bold'),frameon=True,loc='upper right')
at.patch.set_boxstyle("round,pad=0.,rounding_size=0.1")
ax.add_artist(at)

plt.tight_layout()

plt.savefig('./img/decision_%s.png'%ort,dpi=240,transparent=False,bbox_inches='tight',pad_inches=0.0)