
Home
Data download
Further Information
20th Century
Citation
Contact
Links
CMIP5 repository
RCP Database
RCP Concentration Calculations and Data
Final Version, background data, acknowledgements and further info.
A description of the below data and this group's work is available in:
Meinshausen, M., S. J. Smith, K. V. Calvin, J. S. Daniel, M. L. T. Kainuma, J.-F. Lamarque, K. Matsumoto, S. A. Montzka, S. C. B. Raper, K. Riahi, A. M. Thomson, G. J. M. Velders and D. van Vuuren (2011). "The RCP Greenhouse Gas Concentrations and their Extension from 1765 to 2300." Climatic Change (Special Issue), DOI: 10.1007/s10584-011-0156-z, freely available online (PDF) (HTML)
| Please note: |
1. Since 30th May 2010, the final RCP6 datasets and supplementary extensions are available, in addition to RCP8.5, RCP4.5 and RCP3PD (available since 30th November 2009).
The suite of recommended input files to be used in CMIP5 experiments are (going to be) available via the
RCP Database at www.iiasa.ac.at/web-apps/tnt/RcpDb/. 2. This site continues to document all the data produced or modified by the 'RCP concentration calculation and data group' and provides background explanations. Note that this site not only contains the CMIP5 recommended datasets (accessible as well via the RCP database, see above), but that some of data posted here, i.e. radiative forcing, is not part of the CMIP5 recommendations and is provided for transparency in how we derived the greenhouse gas concentrations for the RCPs. Please refer to the documentation M. Meinshausen, S. Smith, et al. "The RCP Greenhouse Gas Concentrations and their extension from 1765 to 2500" (2011), Climatic Change (Special Issue on RCPs) (PDF) (HTML) 3. CMIP5 contributors are advised to check out as well the PCMDI CMIP5 site for a complete overview of how the CMIP5 experiments are to be conducted. 4. Last but not least, a big thanks goes out to all those in the scientific community, that contributed invaluable assistance, datasets, model code and review comments. Without those contributions, this working step in preparation for the IPCC AR5 (of turning the IAM output into Earth System Model concentration input) would not have been possible. We are especially indebted to John Daniel, and Guus Velders for providing the WMO 2006 scenarios, to Steve Montzka, Tom Wigley, Sarah Raper, Jean Francois Lamarque, Robert Andres, Greg Marland, Richard Houghton, Judith Lean, David Worton, Makiko Sato and the people behind data.giss.nasa.gov , Edward Dlugokencky, Patricia Lang, Kenneth A. Masarie, D.M. Etheridge, J.A. Culbertson, G.S. Dutton, T.M. Thompson, J.W. Elkins, B.D. Hall, J. Flueckiger, J. van Aardenne, J. Nabel, K. Markmann, J. Rogelj, Chris Jones, and many, many others. |
The Task Group 'RCP Concentrations Calculation and Data' harmonised and consolidated greenhouse gas concentration and emission datasets for the pre-industrial control runs, 20th century, and the Representative Concentration Pathways (RCPs). The mixing ratios for the long-lived greenhouse gases provided below are the CMIP5 recommendation for Earth System Models in preparation of the IPCC Fifth Assessment Report. On this website: we provide as well additional background data, which is NOT part of the CMIP5 recommendations. For more information, please see the central CMIP5 PCMDI website and the RCP emission scenario database and our documentation: M. Meinshausen, S. Smith, et al. "The RCP Greenhouse Gas Concentrations and their extension from 1765 to 2500" (2011), Climatic Change (Special Issue on RCPs) (PDF) (HTML)
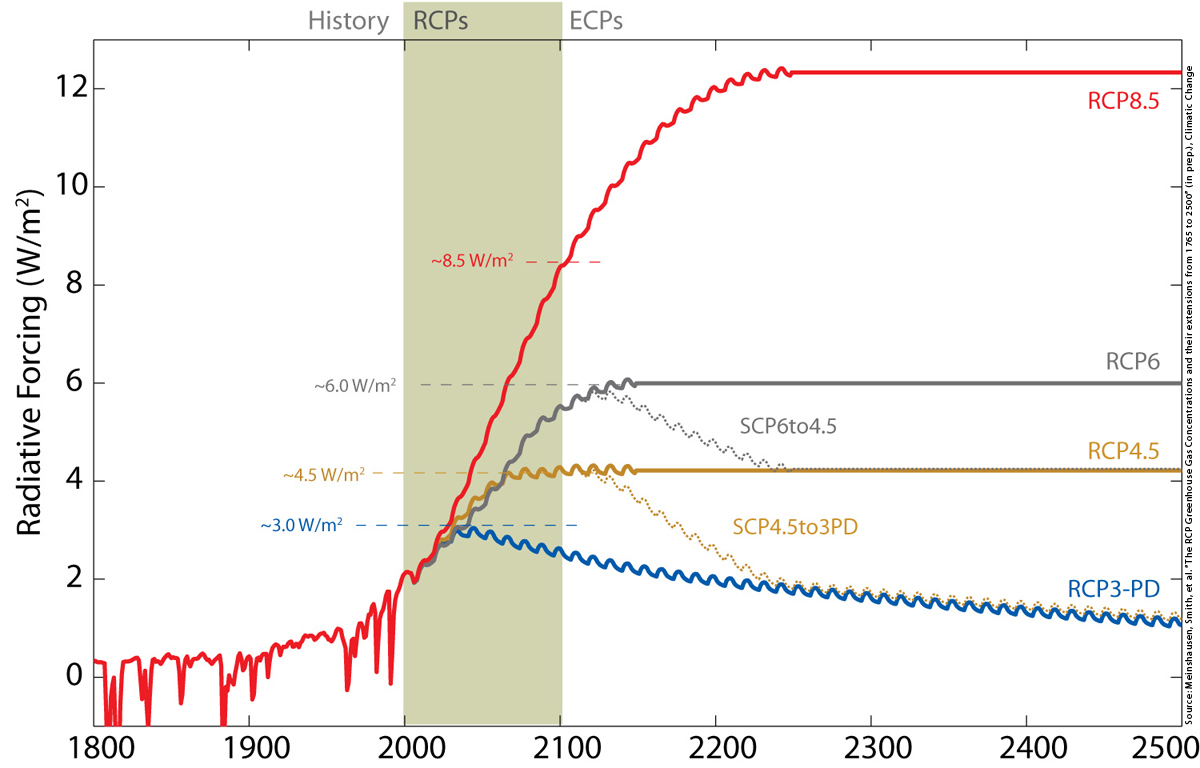 Fig. Global Anthropogenic Radiative Forcing for the high RCP8.5, the medium-high RCP6,
the medium-low RCP4.5 and the low RCP3-PD.
In addition, two supplementary extensions are shown, connecting RCP6.0 levels to RCP4.5 levels by 2250 (SCP6TO45) or RCP45 levels to RCP3PD concentrations and forcings (SCP45to3PD).
No uncertainty ranges are shown and reported, as for creating the recommendation datasets for CMIP5, central estimates have been assumed closely in line with central estimates in IPCC AR4.
Fig. Global Anthropogenic Radiative Forcing for the high RCP8.5, the medium-high RCP6,
the medium-low RCP4.5 and the low RCP3-PD.
In addition, two supplementary extensions are shown, connecting RCP6.0 levels to RCP4.5 levels by 2250 (SCP6TO45) or RCP45 levels to RCP3PD concentrations and forcings (SCP45to3PD).
No uncertainty ranges are shown and reported, as for creating the recommendation datasets for CMIP5, central estimates have been assumed closely in line with central estimates in IPCC AR4. On this website, only a part of the recommended RCP CMIP5 datasets are available, i.e. the GHG concentration timeseries (which are as well mirrored the central RCP emission scenario database ). For transparency purposes, this website here documents all consolidated GHG concentration, harmonized emission datasets and forcing timeseris that have been used within the RCP 'concentration calculation and data' group. Please note again, that only the GHG concentrations shown below are CMIP5 recommendations, with forcing agents like tropospheric ozone, stratospheric ozone, aerosol abundances, and land-use pattern information to be taken from elsewhere, as detailed on the central CMIP5 PCMDI website and the RCP emission scenario database pages. The data can be used free of charge and for non-commercial purposes. Please cite: M. Meinshausen, S. Smith et al. "The RCP greenhouse gas concentrations and their extension from 1765 to 2500" (2011), Climate Change, Special RCP Issue.(PDF) (HTML)
CMIP5 Recommendation*: |
For information: |
||
Global Annual Mean Mixing Ratios: |
Harmonised Emissions: |
Global Annual Mean Radiative Forcing: |
|
Historical Data, RCPs and Standard Extensions: |
|||
| pdcntrl: Pre-Industrial Control Run: |
ASCII (5 KB) XLS (23 KB) |
- | - |
| 20c3m: 20th century (1765-2005): |
ASCII (0.2 MB) XLS (0.2 MB) |
ASCII (0.2 MB) XLS (140 KB) |
ASCII (0.2 MB) XLS (0.2 MB) |
| RCP3-PD: Low RCP with Peak & Decline (2005-2500): |
ASCII (0.5 MB) XLS (0.4 MB) |
ASCII (0.6 MB) XLS (0.4 MB) MAGICC6 (42 KB) |
ASCII (0.7 MB) XLS (0.6 MB) |
| RCP4.5: Medium-Low RCP with stabilisation from 2150 onwards (2005-2500): |
ASCII (0.5 MB) XLS (0.5 MB) |
ASCII (0.6 MB) XLS (0.5 MB) MAGICC6 (0.1 MB) |
ASCII (0.7 MB) XLS (0.6 MB) |
| RCP6: Medium-High RCP with stabilisation from 2150 onwards (2005-2500): |
ASCII (0.5 MB) XLS (0.5 MB) |
ASCII (0.6 MB) XLS (0.5 MB) MAGICC6 (0.1 MB) |
ASCII (0.7 MB) XLS (0.6 MB) |
| RCP8.5: High RCP, stabilising emissions post-2100, concentrations post-2200 (2005-2500): |
ASCII (0.5 MB) XLS (0.4 MB) |
ASCII (0.6 MB) XLS (0.6 MB) MAGICC6 (92 KB) |
ASCII (0.7 MB) XLS (0.6 MB) |
Supplementary Extensions (not CMIP5 recommendation): |
|||
| RCP6 & SCP6-TO-4.5:
First RCP6 up to 2100, then transitioning towards RCP4.5, sharing the same concentrations as the RCP4.5 extension after 2250: |
ASCII (0.5 MB) XLS (0.4 MB) |
ASCII (0.6 MB) XLS (0.6 MB) MAGICC6 (120 KB) |
ASCII (0.7 MB) XLS (0.6 MB) |
| RCP4.5 & SCP4.5-TO-3PD:
First RCP4.5 up to 2100, then transitioning towards RCP3-PD, sharing the same concentrations as the RCP3-PD extension after 2250: |
ASCII (0.5 MB) XLS (0.4 MB) |
ASCII (0.6 MB) XLS (0.6 MB) MAGICC6 (120 KB) |
ASCII (0.7 MB) XLS (0.6 MB) |
| Download all data: |
|||
| (1) Compilation of all above data in a single .zip file; (2) Graphical overview file with 131 figures. | All Data ZIP (6.0 MB) All data in 129 Figures PDF (1.6 MB) |
||
Notes:
*Updates, 30th May 2010: Additional files provided are for the medium-high RCP6, and two supplementary extensions that combine RCP6 & SCP6-TP-4.5, and RCP4.5 & SCP4.5-TP-3PD, respectively. Numerical values of all other data files stayed the same, although the description was updated (e.g. The first column in the concentration files that comprises all anthropogenic forcings was incompletely described when listing the contained GHG concentrations. Now ammended for clarity.)
*CMIP5 Recommendation: Only the mixing ratios for long-lived GHG emissions are CMIP5 recommendation. (Exception: Emission-driven ESM runs). Note that compounds with a short atmospheric residence time including tropospheric ozone are provided by J.F. Lamarque et al., see CMIP5 PCMDI website.
*Timespan: For convenience, RCP3PD, RCP45, RCP6 and RCP85 datasets, as well as two supplementary extension files include datasets between 1765 and 2005, identical to the provided 20c3m dataset.
*Fileformats: (1) 'ASCII' files are .DAT ASCII files, which can be opened with standard text editors. (2) 'XLS' files are MS Excel .xls files, which can be opened with MS Excel, Open Office, Numbers or other spreadsheet programs. (3) 'MAGICC' are ASCII files, which provide regional emission data information formatted to be used with MAGICC 6.3 or higher - as used for computing the Mixing Ratios recommendation and consolidated forcing information.
*Update (April 2012). It has been pointed out, that the volcanic radiative forcing source information is incomplete in the provided files. While after 1850, GISS stratospheric optical thickness data was the starting point (as indicated in the provided files above), for pre-1850 times, the volcanic forcing is derived from Hegerl, Crowley et al. 2006, available here.
The Task Group 'RCP Concentrations Calculation and Data' was asked to produce harmonised and consolidated concentration and emission datasets for the four RCP datasets RCP3-PD (low), RCP45 (medium-low), RCP6 (medium-high), and RCP85 (high).
1. 20th century Mixing Ratios
A set of 20th century global and annual mean mixing ratios was compiled based on available authoratative sources. The greenhouse gas mixing ratios, in particular CO2, N2O, HFCs, PFCs, SF6 and the ozone depleting substances ODS, are recommended for being used in the 20th century runs in preparation of IPCC AR5. Here, data is provided for the full time span from 1765 to 2005, although modelling groups might decide to start their model runs only in 1850. Please consult the CMIP5 PCMDI website for further information in regard to other compounds, including short-lived greenhouse gas concentration fields for tropospheric ozone or methane. These additional short-lived compounds are included in the above consolidated datasets but are not the CMIP5 recommendation. More information ...
2. Harmonised Emissions
We harmonised greenhouse gas, tropospheric ozone precursor and aerosol emissions across the five RCP regions OECD, REF (Economies in Transition), ASIA, MAF (Middle East and Africa), and LAM (Latin America). Due to this harmonisation process, all harmonised RCPs now share the same 2000 to 2005 emission data. The harmonised 2000-2005 data is based on, where available, RCP year 2000 inventory data, inverse emission estimates (mainly for HFCs, PFCs, SF6), or literature sources (e.g. using Marland et al. for fossil&industrial CO2 emissions). The post-2005 were adjusted gas-by-gas using linearly decreasing scaling factors or offsets. (For background information and all the original RCP emissions, please visit the RCP emission scenario database. In the future, harmonised emissions will be available as well from there.)
3. RCP post-2100 extensions
The RCP emission scenarios produced by the integrated assessment models extend only to 2100. In order to provide data needed for conducting long-term climate change projections the concentration values from these scenarios have been extended to 2300 (The data provided here actually extends all the way to 2500). These extensions, the so-called ECPs (Extended Concentration Pathways), were calculated using simple rules developed in a series of stakeholder consultations. These do not represent fully consistent scenarios. The rules used for the extension are:
- RCP3PD: Constant emissions after 2100.
- RCP4.5: Constant concentrations after 2150 with smooth transition between 2100 and 2150.
- RCP6.0: Constant concentrations after 2150 with smooth transition between 2100 and 2150.
- RCP8.5: Constant emissions after 2100 and constant concentrations after 2250 with smooth transition of emissions between 2150 and 2250.
4. Supplementary post-2100 extensions
Apart from the standard extensions for each RCP, two supplementary extensions are provided above. In particular, stakeholders were interested in an extension which combines concentrations again in the long-term, after initially following different pathways. Thus, we provide two supplementary extensions, which are not part of the CMIP5 recommendations:
- SCP6-TO-4.5: Starting from RCP6, concentrations are adjusted after 2100 in order to join the levels of the next lower scenario RCP4.5 by 2250.
- SCP4.5-TO-3PD: Starting from RCP4.5, concentrations are adjusted after 2100 in order to join the levels of the next lower scenario RCP3PD by 2250.
5. RCP emission completion
The RCP emission scenarios were ammended by a series of emissions that were not provided by the Integrated Assessment Models.
For example, most of the emission projections for ozone depleting substances are generously provided by the WMO assessment report researchers
Guus Velders, John Daniel et al. (WMO 2006).
Only slight modifications have been done from the WMO 2006 A1 baseline scenario.
Namely, HCFC 142b emissions have been ajusted over 2005 to 2007 towards the inverse emission estimates reported in Montzka et al. (2009).
RCP3-PD provided alternative pathways for some ODS, which replaced respective WMO A1 baseline projections.
6. RCP Concentrations recommendation
The harmonised RCP emission datasets were then run through a reduced-complexity coupled carbon cycle climate model, namely MAGICC 6.3. In reality, there is some uncertainty on what the mixing ratios are going to be for a particular emission pathway. In particular for CO2, where carbon cycle feedback uncertainties suggest a relatively broad range in possible future concentrations, a decision needed to be made what the consolidated concentration recommendation for CMIP5 should be. Here, both the climate and carbon cycle components are calibrated to provide a medium-range estimate of models available in IPCC Fourth Assessment Report. Namely, the carbon cycle model has been calibrated towards the median of C4MIP (Friedlingstein et al., 2006) model comparison results and the climate model component reflects the median of calibrations to CMIP3 AOGCMs (Meehl et al., 200X). The calibrations towards the individual models are decribed in Meinshausen et al.(2011, ACP).
7. For information purposes: Radiative Forcing
For information purposes only, we provide here the radiative forcing results (following a standard IPCC forcing definition, i.e. after stratospheric temperature adjustment). These forcings will as much as possible be diagnosed from the radiative transfer schemes of ESMs and not be used as input. However, for some models of intermediate complexity that do not have all gas cycles included, these standardised radiative forcing estimates might be useful for running RCPs. All radiative forcing time series closely reflect either best-estimate IPCC AR4 values for 2005, or, if not available, radiative efficiencies, e.g. for individual HFC and ODS gases.
Regarding volcanic forcing: Note that volcanic forcing, as the other radiative forcing series, are here provided only for transparency, not as a CMIP5 recommendation. The radiative forcing series was derived from the GISS radiative forcing series by Sato et al., available on data.giss.nasa.gov and extended by the zonal radiative forcing estimates by Hegerl, Crowley et al. 2006, as provided on the Nature Supplementary Information website . Radiative forcing was multipled by 0.7 and shifted for a zero historical mean.
Concentration Data:
M. Meinshausen, S. Smith, et al. "The RCP Greenhouse Gas Concentrations and their extension from 1765 to 2500" (2011), Climatic Change (Special Issue on RCPs) (PDF) (HTML)
RCP 3-PD:
* van Vuuren, D., M. den Elzen, P. Lucas, B. Eickhout, B. Strengers, B. van Ruijven, S. Wonink, R. van Houdt, 2007. Stabilizing greenhouse gas concentrations at low levels: an assessment of reduction strategies and costs. Climatic Change, doi:10.1007/s/10584-006-9172-9.
RCP 4.5:
* Clarke, L., J. Edmonds, H. Jacoby, H. Pitcher, J. Reilly, R. Richels, 2007. Scenarios of Greenhouse Gas Emissions and Atmospheric Concentrations. Sub-report 2.1A of Synthesis and Assessment Product 2.1 by the U.S. Climate Change Science Program and the Subcommittee on Global Change Research. Department of Energy, Office of Biological & Environmental Research, Washington, 7 DC., USA, 154 pp.
* Smith, S.J. and T.M.L. Wigley, 2006. Multi-Gas Forcing Stabilization with the MiniCAM. Energy Journal (Special Issue #3) pp 373-391.
* Wise, MA, KV Calvin, AM Thomson, LE Clarke, B Bond-Lamberty, RD Sands, SJ Smith, AC Janetos, JA Edmonds. 2009. Implications of Limiting CO2 Concentrations for Land Use and Energy. Science. 324:1183-1186. May 29, 2009.
RCP 6.0:
* Fujino, J., R. Nair, M. Kainuma, T. Masui, Y. Matsuoka, 2006. Multi-gas mitigation analysis on stabilization scenarios using AIM global model. Multigas Mitigation and Climate Policy. The Energy Journal Special Issue.
RCP 8.5:
* Riahi, K. Gruebler, A. and Nakicenovic N.: 2007. Scenarios of long-term socio-economic and environmental development under climate stabilization. Technological Forecasting and Social Change 74, 7, 887-935.
Please use the following references for the historical projections and inventory data presented in the RCP Database:
Grassland and forest fire emissions:
* For the "year 2000" climatology please refer to the following publication: Van der Werf, G., J. T. Randerson, L. Giglio, G. J. Collatz, P. S.
Kasibhatla, and A. F. Arellano Jr. (2006), Interannual variability in global biomass burning emissions from 1997 to 2004, Atmos. Chem. Phys., 6, 34233441.
* For the 1960-2000 RETRO inventory use:
Schultz, M.G., A. Heil, J.J. Hoelzemann, A. Spessa, K. Thonicke, J. Goldammer, A.C. Held, J.M. Pereira, M. van het Bolscher (2008), Global Wildland Fire Emissions from 1960 to 2000, Global Biogeochem. Cyc., doi:10.1029/2007GB003031.
* The reference for the 1850-1960 period is the following: Mieville, A., C. Granier, C. Liousse, B. Guillaume, F. Mouillot, J.F. Lamarque, J.M. Grégoire, G. Pétron (2009), Emissions of gases and particles from biomass burning during the 20th century using satellite data and an historical reconstruction, Atmospheric Environment, submitted.
Please note that emissions over the 1850-2000 period have been harmonized to "year 2000 climatology" emissions.
International shipping emissions:
Ship emission totals for the year 2000 are taken from Table 3 of Eyring et al. (2009).
Historical CO2 ship emission totals from 1850 to 2000 are based on the Second International Maritime Organization (IMO) GHG Study (Buhaug et al., 2009). Historical non-CO2 shipping emission totals are scaled backwards in time by using the IMO CO2 emission time series.
References:
* Buhaug, Ø., J. J. Corbett, Ø. Endresen, V. Eyring, J. Faber, S. Hanayama, D. S. Lee, D. Lee, H. Lindstad, A.Z. Markowska, A. Mjelde, D. Nelissen, J. Nilsen, C. Pålsson, J. J. Winebrake, W.¬Q. Wu, and K. Yoshida, Second IMO GHG study 2009; International Maritime Organization (IMO) London, UK, March, 2009.
* Eyring, V., I. S. A. Isaksen, T. Berntsen, W. J. Collins, J. J. Corbett, O. Endresen, R. G. Grainger, J. Moldanova, H. Schlager, and D. S. Stevenson, Transport impacts on atmosphere and climate: Shipping, Atm. Env., doi:10.1016/j.atmosenv.2009.04.059, 2009.
Aviation emissions:
* Lee et al. (2009) in preparation (QUANTIFY Scenarios) Developed from the approach of Lee, D.S., et al., Aviation and global climate change in the 21st century, Atmospheric Environment (2009), doi:10.1016/j.atmosenv.2009.04.024
Sulfur emissions of all other sectors:
* For historical and year 2000 sulfur emissions of all sectors except the ones listed above please refer to:
Smith et al. (2009) in preparation; updated from Smith, Steven J., Pitcher, H., and Wigley, T.M.L. (2001) Global and Regional Anthropogenic Sulfur Dioxide Emissions. Global and Planetary Change 29/1-2, pp 99-119 Smith, Steven J, Robert Andres, Elvira Conception and Josh Lurz (2004) Sulfur Dioxide Emissions: 1850-2000 (JGCRI Report. PNNL-14537).
Black and organic carbon emissions of all other sectors:
* For historical and year 2000 black and organic carbon emissions of all sectors except the ones listed above please use:
Updated from: Bond, T.C., E. Bhardwaj, R. Dong, R. Jogani, S. Jung, C. Roden, D.G. Streets, S. Fernandes, and N. Trautmann (2007), Historical emissions of black and organic carbon aerosol from energy-related combustion, 1850-2000, Glob. Biogeochem. Cyc., 21, GB2018, doi:10.1029/2006GB002840, with new emissions factors developed in collaboration with C. Liousse
NOx, CO, CH4 and NMVOC emissions of all other sectors:
* JF Lamarque, C Granier, TC Bond, V Eyring, A Heil, M Kainuma, Z Klimont, D Lee, C Liousse, A Mieville, B Owen, K Riahi, M Schultz, D Shindell, S Smith, E S, A Thomson, J Van Aardenne and D Van Vuuren, JR McConnell, S Oltmans, D Parrish, O Cooper. Historical (1850-2000) gridded anthropogenic and biomass burning emissions of reactive gases and aerosols: methodology and application (under preparation).
Malte Meinshausen (malte.meinshausen +add+ pik-potsdam.de)
Steve Smith (ssmith +add+ pnl.gov)
RCP3-PD (IMAGE): Detlef van Vuuren (detlef.vanvuuren +add+ pbl.nl)
RCP4.5 (MiniCAM): Allison Thomson (Allison.Thomson +add+ pnl.gov)
RCP6 (AIM): Toshihiko Masui (masui +add+ nies.go.jp)
RCP8.5 (MESSAGE): Keywan Riahi (riahi +add+ iiasa.ac.at)
RCP emission scenario database hosted at IIASA
IMAGE group at PBL, Netherlands (RCP 3-PD)
GCAM/MiniCAM model at PNL, USA (RCP 4.5)
AIM group at NIES, Japan (RCP 6)
MESSAGE group at IIASA, Austria (RCP 8.5)