Various methods have been proposed for representing different
sources of uncertainty in assessments of knowledge about climate
change, and these have recently received intense scrutiny
following debate surrounding the methods applied by the
Intergovernmental Panel on Climate Change in its Fourth
Assessment Report (Morgan et al., 2009; Swart et al., 2009; IAC,
2010). Out of this discussion, including a formal review of IPCC
procedures by the Inter Academy Council (IAC, 2010), a new set of
best practice guidelines have been prepared ahead of the IPCC
Fifth Assessment (AR5 – Mastrandrea et al., 2010). Here, authors
of the AR5 are recommended to communicate uncertainties in
scientific findings about climate change in one of two ways:
- Confidence in the validity of a finding, expressed qualitatively,
based on the type, amount, quality, and consistency of evidence
(e.g., mechanistic understanding, theory, data, models, expert
judgment) and the degree of agreement (Figure 3-10).
- Quantified measures of uncertainty in a finding expressed probabilistically
(based on statistical analysis of observations or model results, or
expert judgment). Here labels are associated with quantitative
likelihoods (99-100%probability is described as "virtually certain",
90-100% as "very likely", 66-100% as "likely", 33 to 66% as "about as
likely as not", 0-33% as "unlikely", 0-10% as "very unlikely" and
0-1% as "exceptionally unlikely").
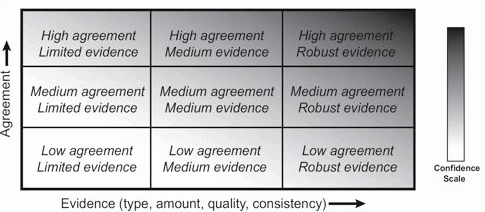
Figure 3-10: Schema used by IPCC authors for judging confidence in a finding, based on the
extent and quality of supporting evidence and the level of agreement among studies. Confidence
is allocated a qualitative rating on a five-point scale: very low, low, medium, high, or very high.
Source: Mastrandrea et al. (2010).
Furthermore,
while researchers frequently attribute uncertainties to outcomes
in isolation (e.g. the probability of a severe summer heatwave at
a given location) there are many dimensions to estimates of
uncertainty that decision makers may need to keep in mind. Thus, to
serve specific decisions, using the heatwave example, uncertainties may
need to be provided:
- in greater physical detail,
e.g. information on the probability of air temperatures above a
key threshold known to be important for heat-related mortality in
the elderly, or temperatures exceeding key thresholds for
cooling water needs at thermal and nuclear energy plants;
- in greater spatial detail,
e.g. describing those parts of a city where temperatures are expected
to exceed tolerable limits for the elderly, due to theurban heat island
effect;
- in greater temporal detail,
e.g. specifying the number of hours with air temperature above a
certain level, to inform electrical utilities of the maximum demand for
air conditioning;
- over different time horizons into the future,
e.g. trends in heatwave likelihood and severity due to anthropogenic
causes over the next decade may be difficult to distinguish from
natural variability, whereas 50 years hence, the signal of change may
well have emerged from the noise of natural variability;
- that are conditional on other assumptions,
e.g. uncertainties of high temperature effects on future cereal yields
will be contingent on the heat tolerance characteristics of the cereal
varieties assumed to be cultivated at that time;
- in combination with uncertainties in other concurrent outcomes, e.g. summer heatwaves are often associated with severe episodes of urban air pollution, or with water shortages.
Confidence in information on any or all of these attributes related to summer heatwaves may be crucial for justifying the types of adaptation response that are appropriate.
Low confidence, high consequence events
One
of the most challenging questions facing both researchers and decision
makers alike, concerns how to treat future events that are of
potentially high consequence, are theoretically plausible but which are
poorly understood and hence of low confidence. Examples include abrupt
deglaciation of the Greenland or Antarctic ice sheets leading to rapid
sea level rise or a sudden rearrangement of ocean circulation with
associated rapid regional changes in climate.
The sea level
example offers a useful illustration of how information on
uncertainties, however weakly grounded, can be of crucial importance
for decision making. Following publications of the AR4, the IPCC faced
criticism by opting to provide uncertainty bounds on the projected rate
of global mean sea level rise during the 21st century that included
onlycontributions from ocean expansion and the melting of mountain
glaciers but omitted the contribution of dynamical responses of the ice
sheets, which could potentially add several tens of centimetres to sea
level rise by 2100 (IPCC, 2007). It has been argued that this reticence
to provide potentially crucial information, which was justified on the
basis ofinsufficient scientific understanding of ice sheet dynamics,
may have misled decision makers and the public, who might not
have appreciated (or even noticed) the significance of the
missing component (Hansen, 2007).
From the decision-maker's
perspective, if damage to critical coastal infrastructure is at
stake, then information about potential worst case sea level rise
scenarios assumes high importance for contingency planning. Some
options for treating this type of situation are explored by
Nicholls et al. (2011), who offer guidance on generating regional sea
levelscenarios based on the IPCC global range, but also accounting for
uncertainties in ice sheet dynamics. They cite a study for London that
appends estimates of ice melt taken from the available literature
to the IPCC range to arrive at an H++ upper limit on sea level rise
for London by 2100 of 1.9 m.
The London example
illustrates how certain circumstances may demand a separate
uncertainty analysis to be undertaken, even in cases of low scientific
understanding. In other cases of high consequence outcomes with
high uncertainty, the IPCC guidance note suggests applying the "low"
and "very low" confidence findings, and providing reasons why
such findings are being highlighted (Mastrandrea et al. 2010).