


Anzahl der Hitzetage hatten eine schmalen Erwartungshorizont mit geringen Abweichungen vom Mittelwert: gut vorhersehbar
Anzahl der Hitzetage haben einen breiten Erwartungshorizont mit großen Abweichungen vom Mittelwert: schlecht vorhersehbar
Verteilungsfunktion mit zwei Maxima?


![]() |
![]() |
![]() |
|---|---|---|
![]() |
![]() |
![]() |

![]() |
![]() |
![]() |
|---|---|---|
![]() |
![]() |
![]() |

![]() |
![]() |
![]() |
|---|---|---|
![]() |
![]() |
![]() |


## Erwärmungsniveas <div> Temperatur|Luftdruck|Andauer Trockentage ---|---|--- || || 
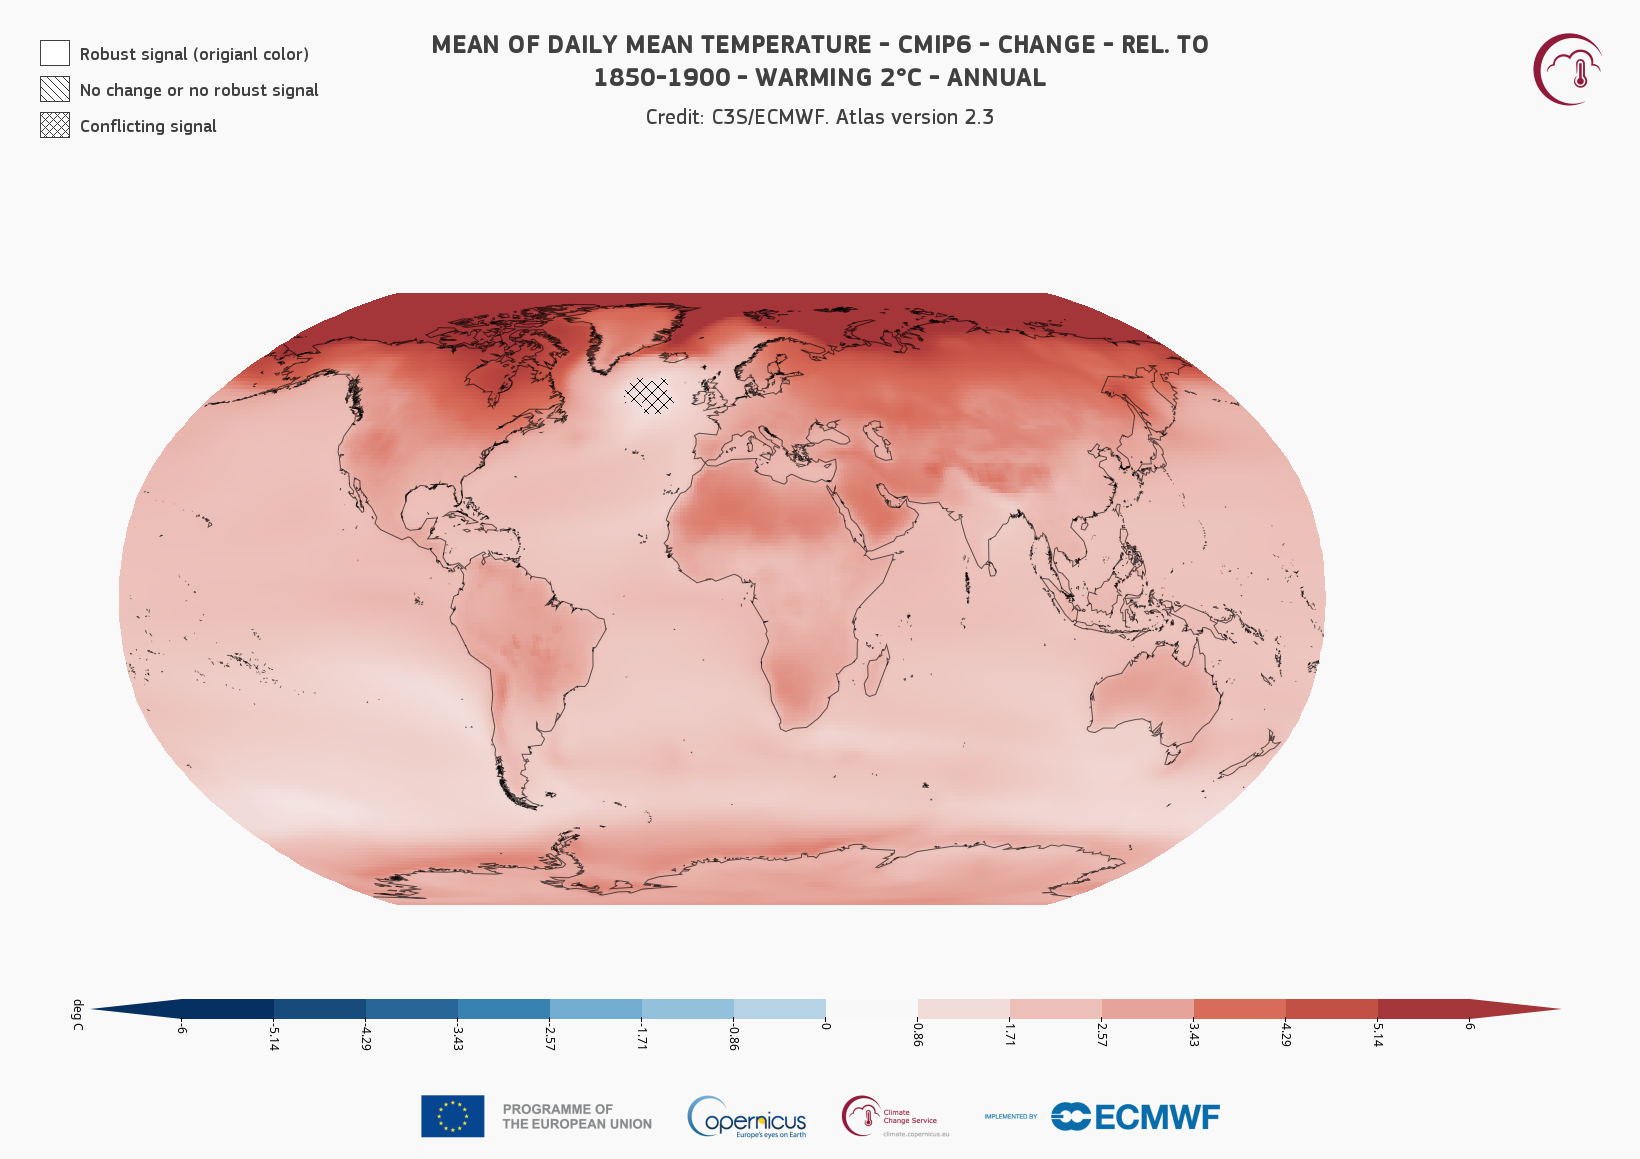
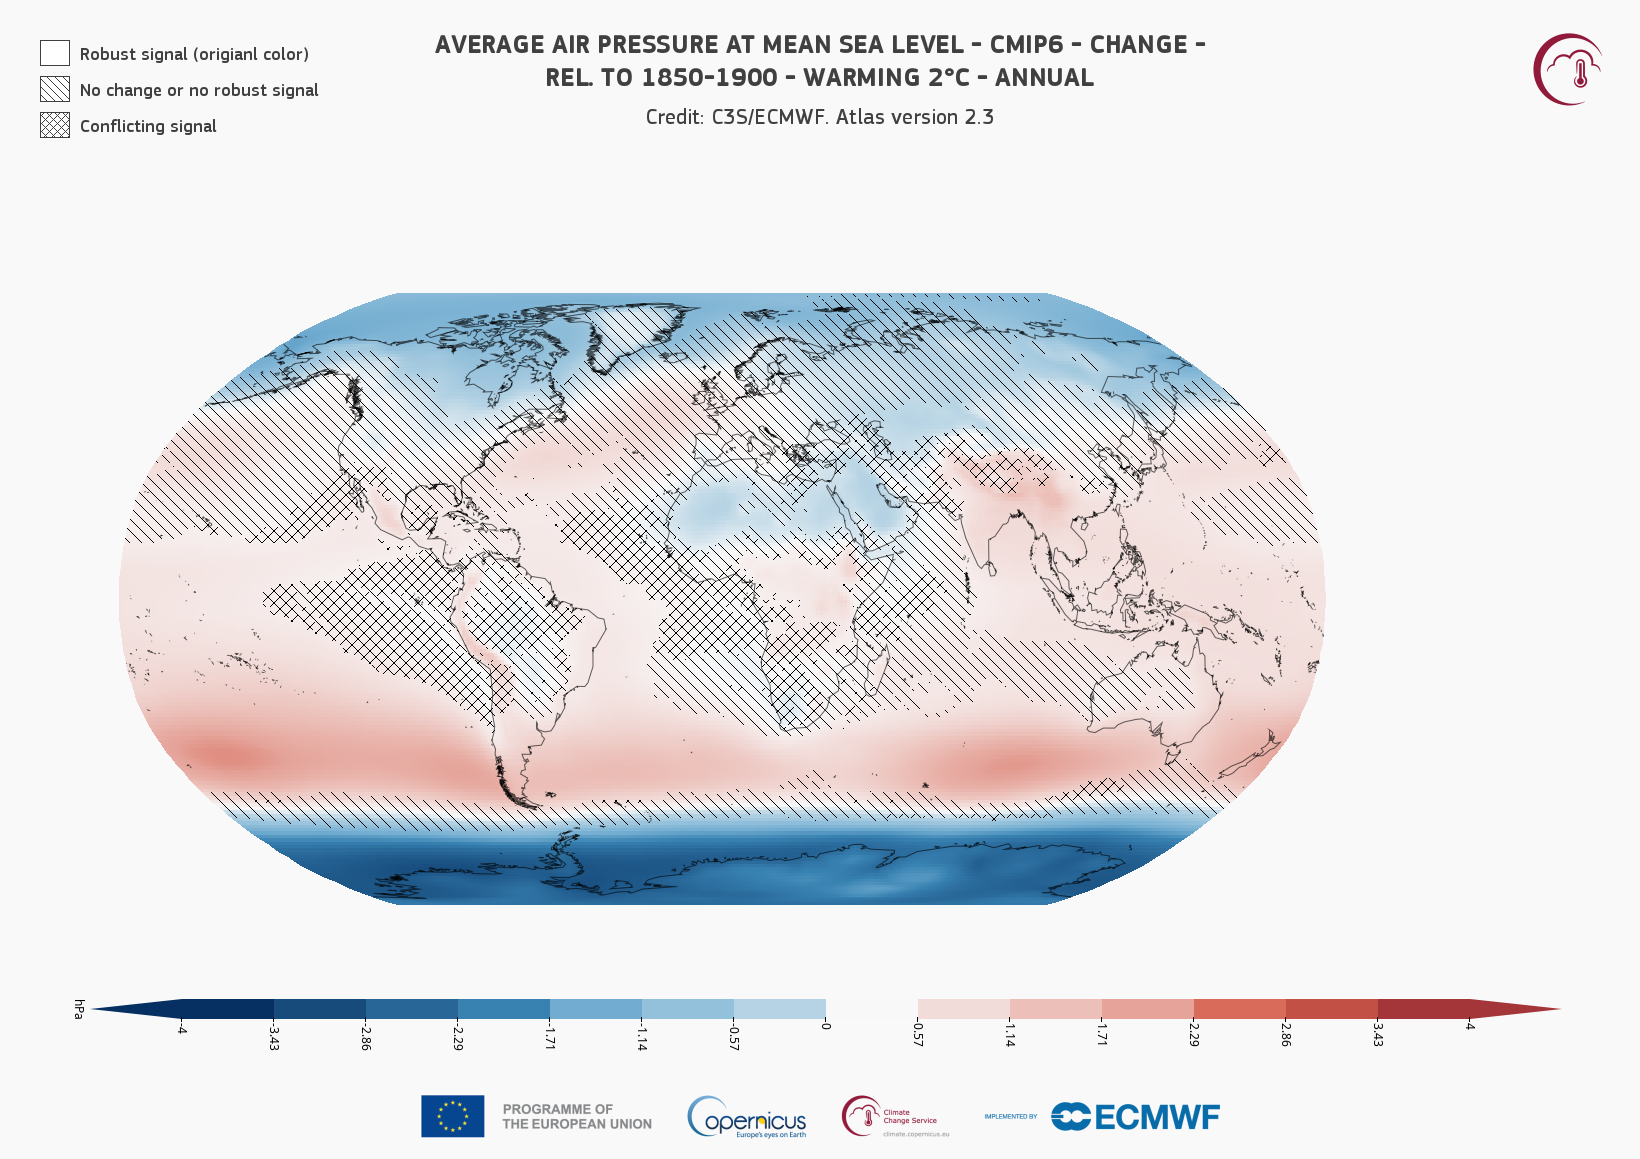
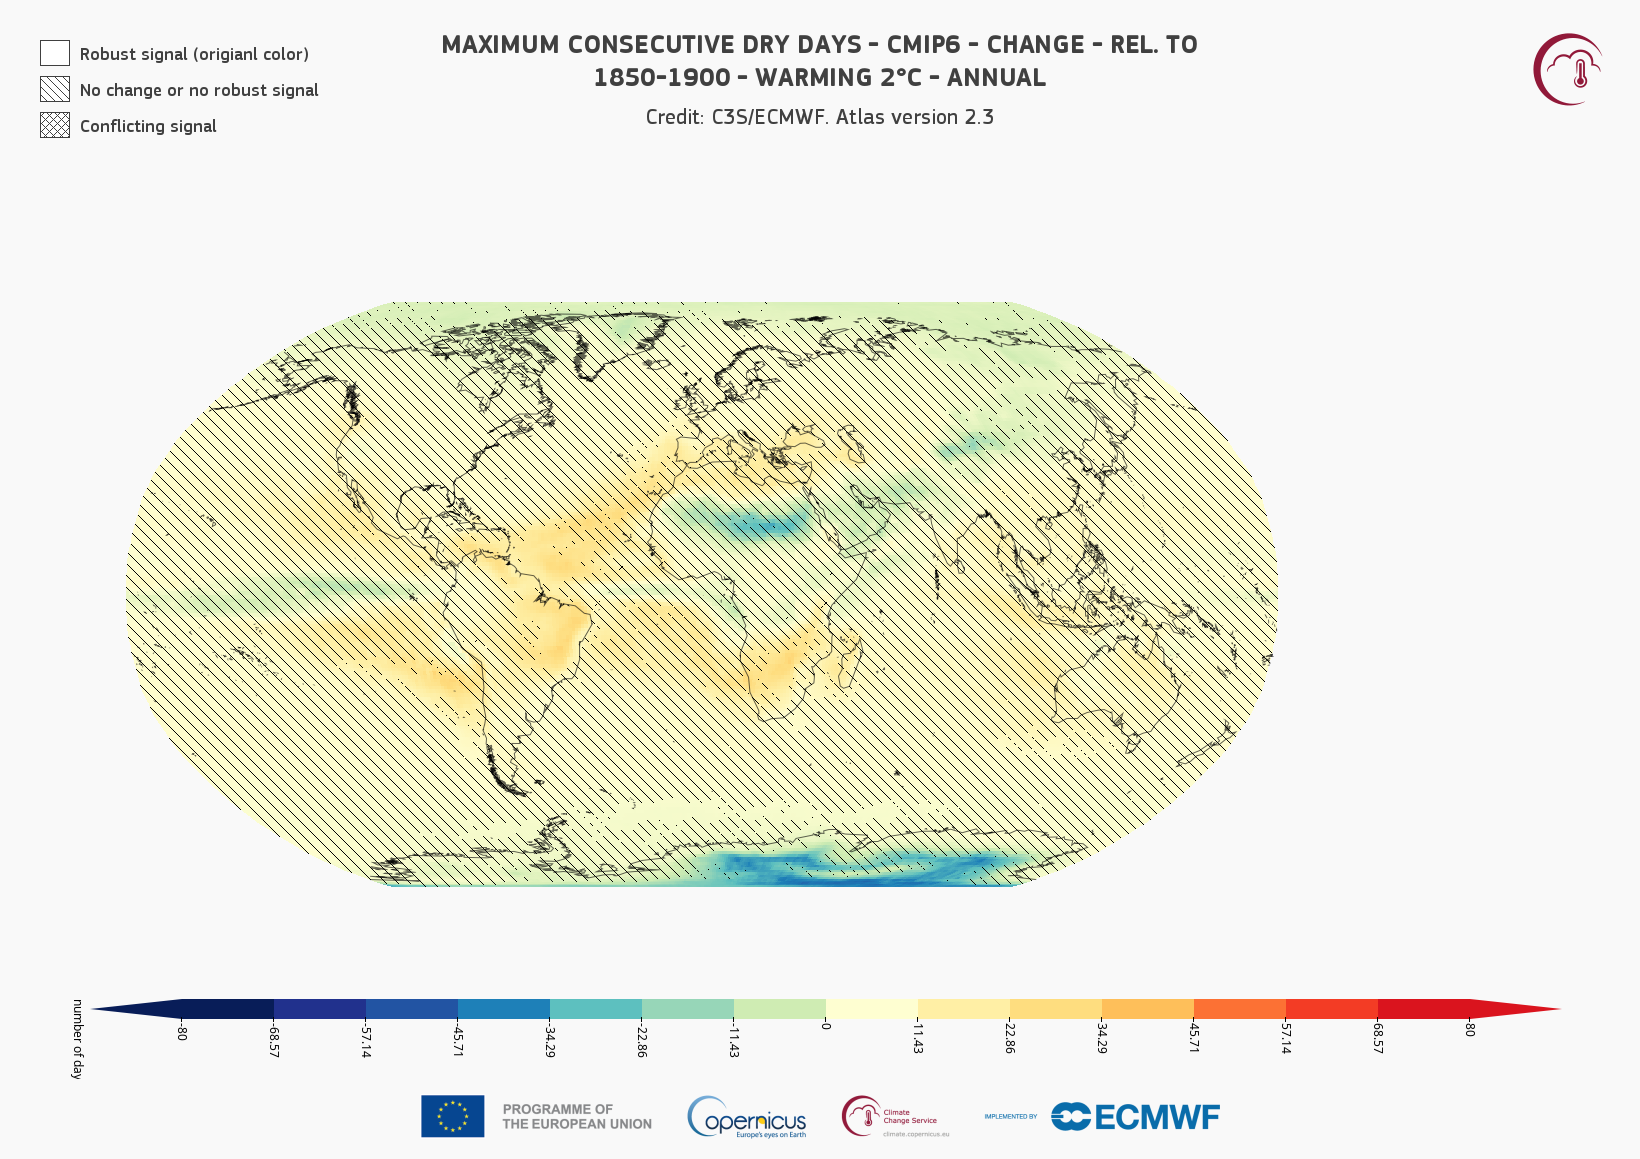
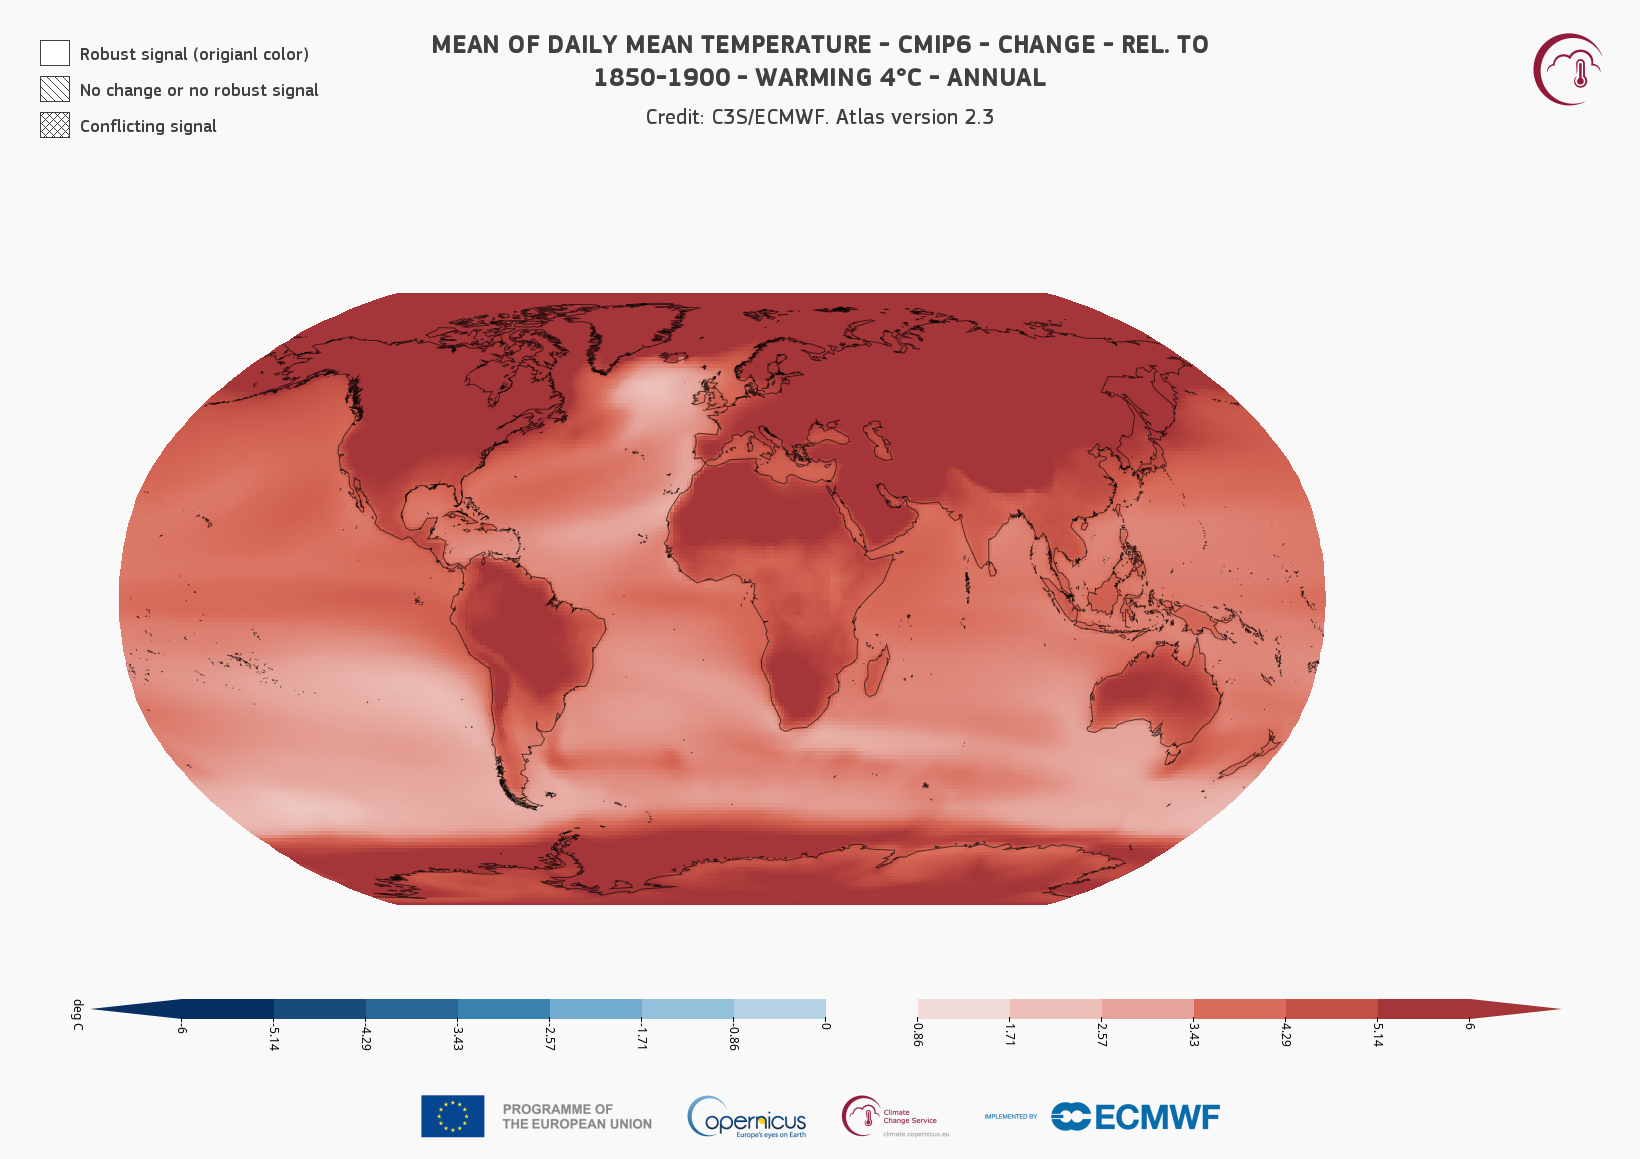
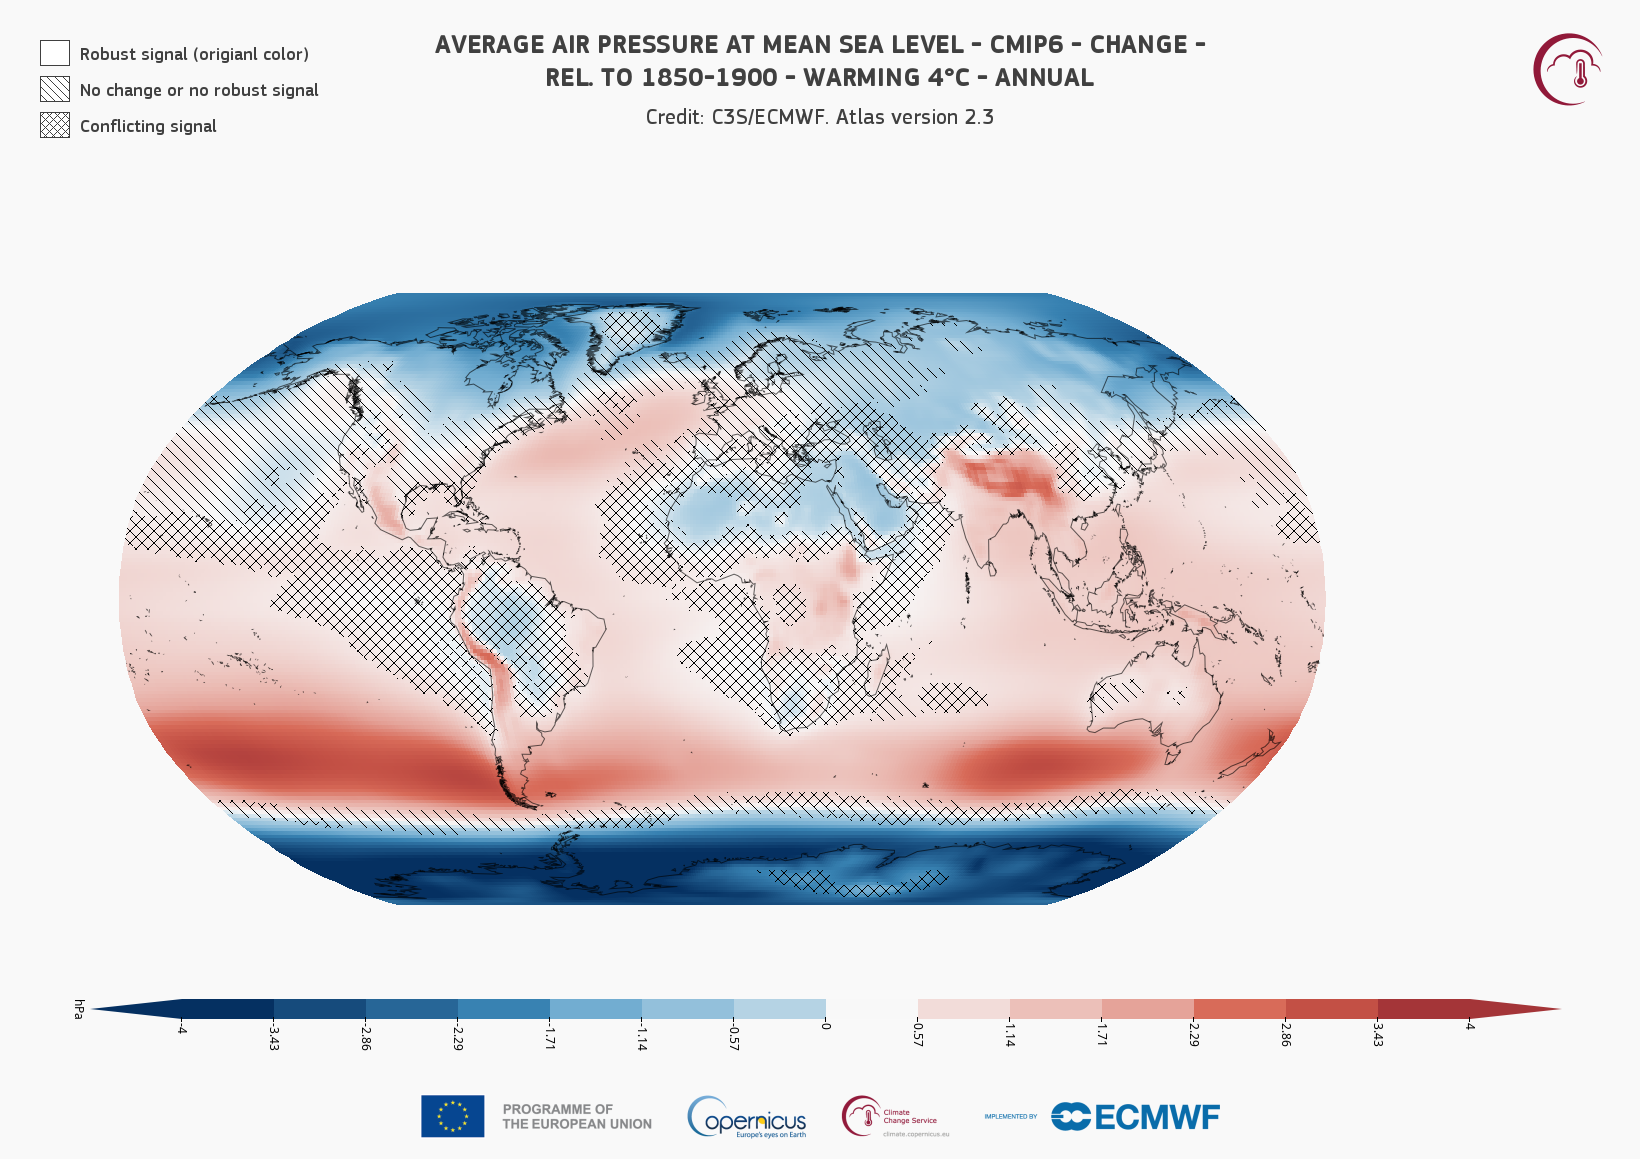
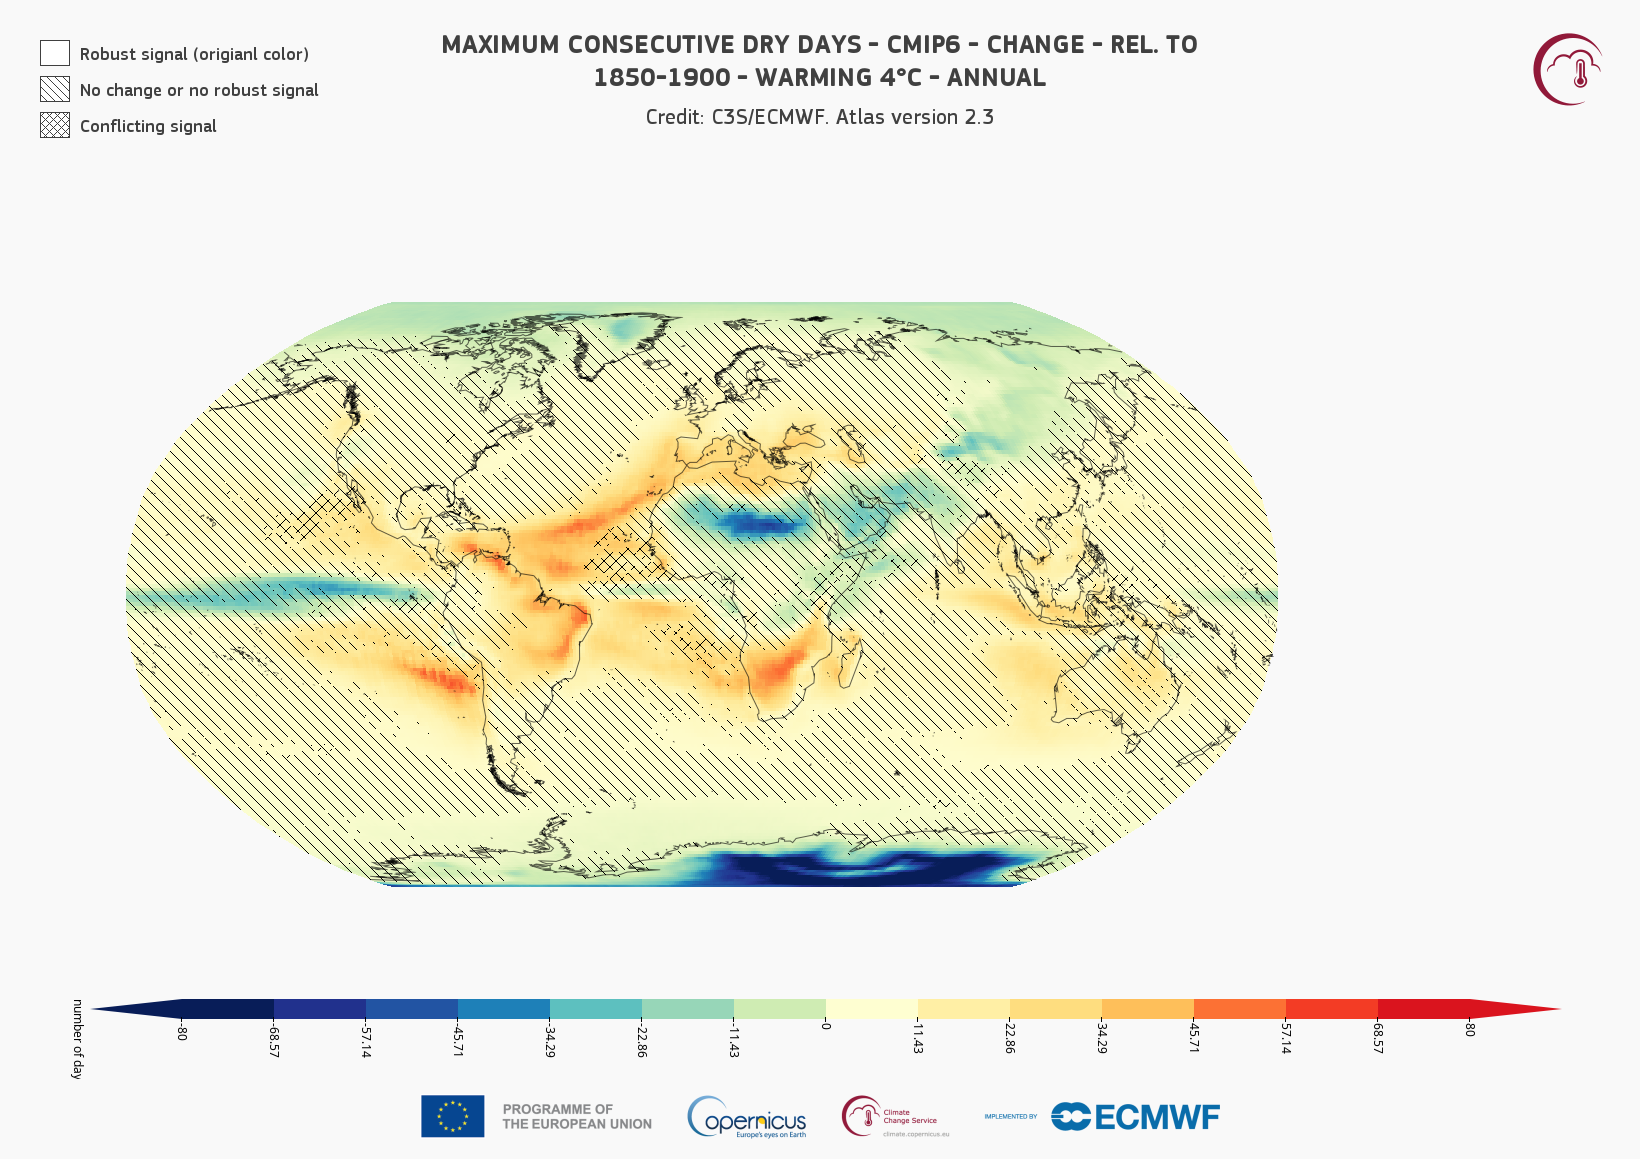
</div> <div style="left:85%; top:35%; position: absolute; font-size: 30pt; color:black"><b>+2°C</b></div> <div style="left:85%; top:70%; position: absolute; font-size: 30pt; color:black"><b>+4°C</b></div> <div style="left:75%; top:93%; position: absolute; font-size: 12pt; color:magenta">Copernicus Atlas</div>