- Thank you Alison and hello everyone - My presentation is about the long-term changes of the weather variability over Europe in the context of climate change. - Climate Change not only effect the mean values and extremes but also the weather variability. - Extreme Weather Events are a small part of the whole spectrum of the weather variability. - To better understand changes in the weather variability we use existing and objective classifications of recurring weather-types over Europe. - Its a topic I'm interested in since I started at PIK in 2012 because PIK also had a long tradition in the analysis of Großwetterlagen.
- Let me begin with temperature anomalies that bring observed temperature values in a climatic context.
- This chart shows the local temperature variability in Potsdam over the last 2 years. - The magnitude of variations from day-to-day is much larger than the climate change signal. - Especially during new year 2023 anomalies were more 10 degrees above the respected values in the 60s to 80s. - On average the last 2 years were 2.3 degrees warmer than the period 1961 to 1990. - However, we will here fokus on the variabiliy mainly determined by the large-scale context of circulation conditions over Europe.
- That's why local weather phenomena need to be considered in a larger context, because the transport of air masses mainly determine the local weather conditions.
- If, for instance, a local extreme weather event occurs, than there is a causal linkage to the large-scale circulation. - A better understanding of the large-scale context and its variability is required in the context of Climate Change. - The context can be given, for instance, by atomospheric field of the geopotential height at 500hPa. - This represents the shape of the circulation in the mittle toposphere. - Its associated with the location of high and low pressure systems near surface. - Now, I will give you two examples for explaination.
- The first example shows retrospectively the large-scale context for extreme rainfall events in Greece. - Why Greece? - Because in September 2023 occured such an heavy rainfall event in Greece with mor than 500 mm within only 24 hours. - The circuations shows a trough over Central Europe associated wit a low-pressure system over the Mediterranean. - This weather pattern can trigger storm water such as for instance in September 2023.
- Another examples shows the context for extreme hot temperature in Hamburg. - In July 2022 40 degree were reported in Hamburg. - Such high temperature in the northern part of Germany are mainly triggered by south-west wind direction. - The shape of the large-scale circulation conditions shows a ridge over Central Europe with a South-West component of the wind direction.
- Thats bring me to the classification of weather-types. - By classifying recurring weather-types we are able to analyse changes in the weather variability. - Every day an local weather situation can be assigned to an attribute that characterize the context. - One expert classification is still operaterated by the DWD after the methodology by Hess/Brezowsky back to early 20th century. - Also PIK had a tradition in the assessment of weather-types or so-called Großwetterlagen.
- The basic idea is to convert the temporal development of atmospheric fields to sequences categorical data. - For example: - HM: High over Central Europe - WZ: Westerly Cyclonic - TB: Low over Britsih Island - etc.
- Here you can see how the respective circulation patterens are represented by the Geopotential Height at 500 hPa. - Each of the 30 different pattern is explained by a characteristic shape. - The upper row show the most dominant patterns or weather-types. - About 15% of the total weather variability is explained by the Westerly Cyclonic (WZ) pattern. - It is dominated by a significant pressure gradient between North and South over the North Atlantic. - The shapes of the other pattherns are dominated by a ridge, a trough or an omega-like pattern. - Every weather-type is associated with characteristic local weather conditions.
- Two examples show composite maps of temperature anomalies for the weather-type High over Central Europe (HM) and total precipitation for Low over Central Europe (TM). - This gives the causal linakge between the large-scale context and local weather phenomena. - HM in summer is associated with high temperature anomalies in westhern Europe. - TM in summer is associated with intense rainfall over Central Europe.
- This matrix shows the precipitation characteristics for Potsdam per month and weather-type. - The driest weather-type is HM in all month. - Against it, TM or TRM are the wettest weather-types, especially in summer.
<div style="left:69%; top:19%; position: absolute; font-size: 30pt; color: red"><b>🠇</b></div>
- How are hydroclimatic extreme events represented by weather-types? - Let me give you 4 examples!
- First: the flood event in May 2013 over the river Elbe and Danube. - Second: Heavy snowfall over the Alps in January 2019. - Third: The catastrophic flash flood event in the Ahrtal in July 2021. - Finally: 40°C in Hamburg in July 2022.
- Changes in the weather-variability can be identified in frequency, persistency and transition.
- Here are shown are monthly distribution functions of weather persistent for the ṕast and present, blue and red respectively. - In April, June and July the persistence has increased, significantly, from 3 to 4 or from 4 to 5 days.
- This result confirmed results of a study in 2021, analysing the similarity of day-to-day pressure fields. - We found increasing trends of the weather persistence in summer over the North-Atlantic and Europe. - Persistent summer over Europe are hot summers and normally dry.
- To summarize: - The longer similar weather-types persist the higher the negative impact for human health, agriculture and critical infrastructure. - This depends on the criticality of the weather-types.
- For the comparison the weather-type frequencies we aranged the categories in a level plot. - On top are located the dominant weather-types: WZ, BM and WA, - Differences between the past (left) and present (right) are visible. - There are three new dominant weather-types: TRW, TRM, SWZ. - They are often associated with weather extremes.
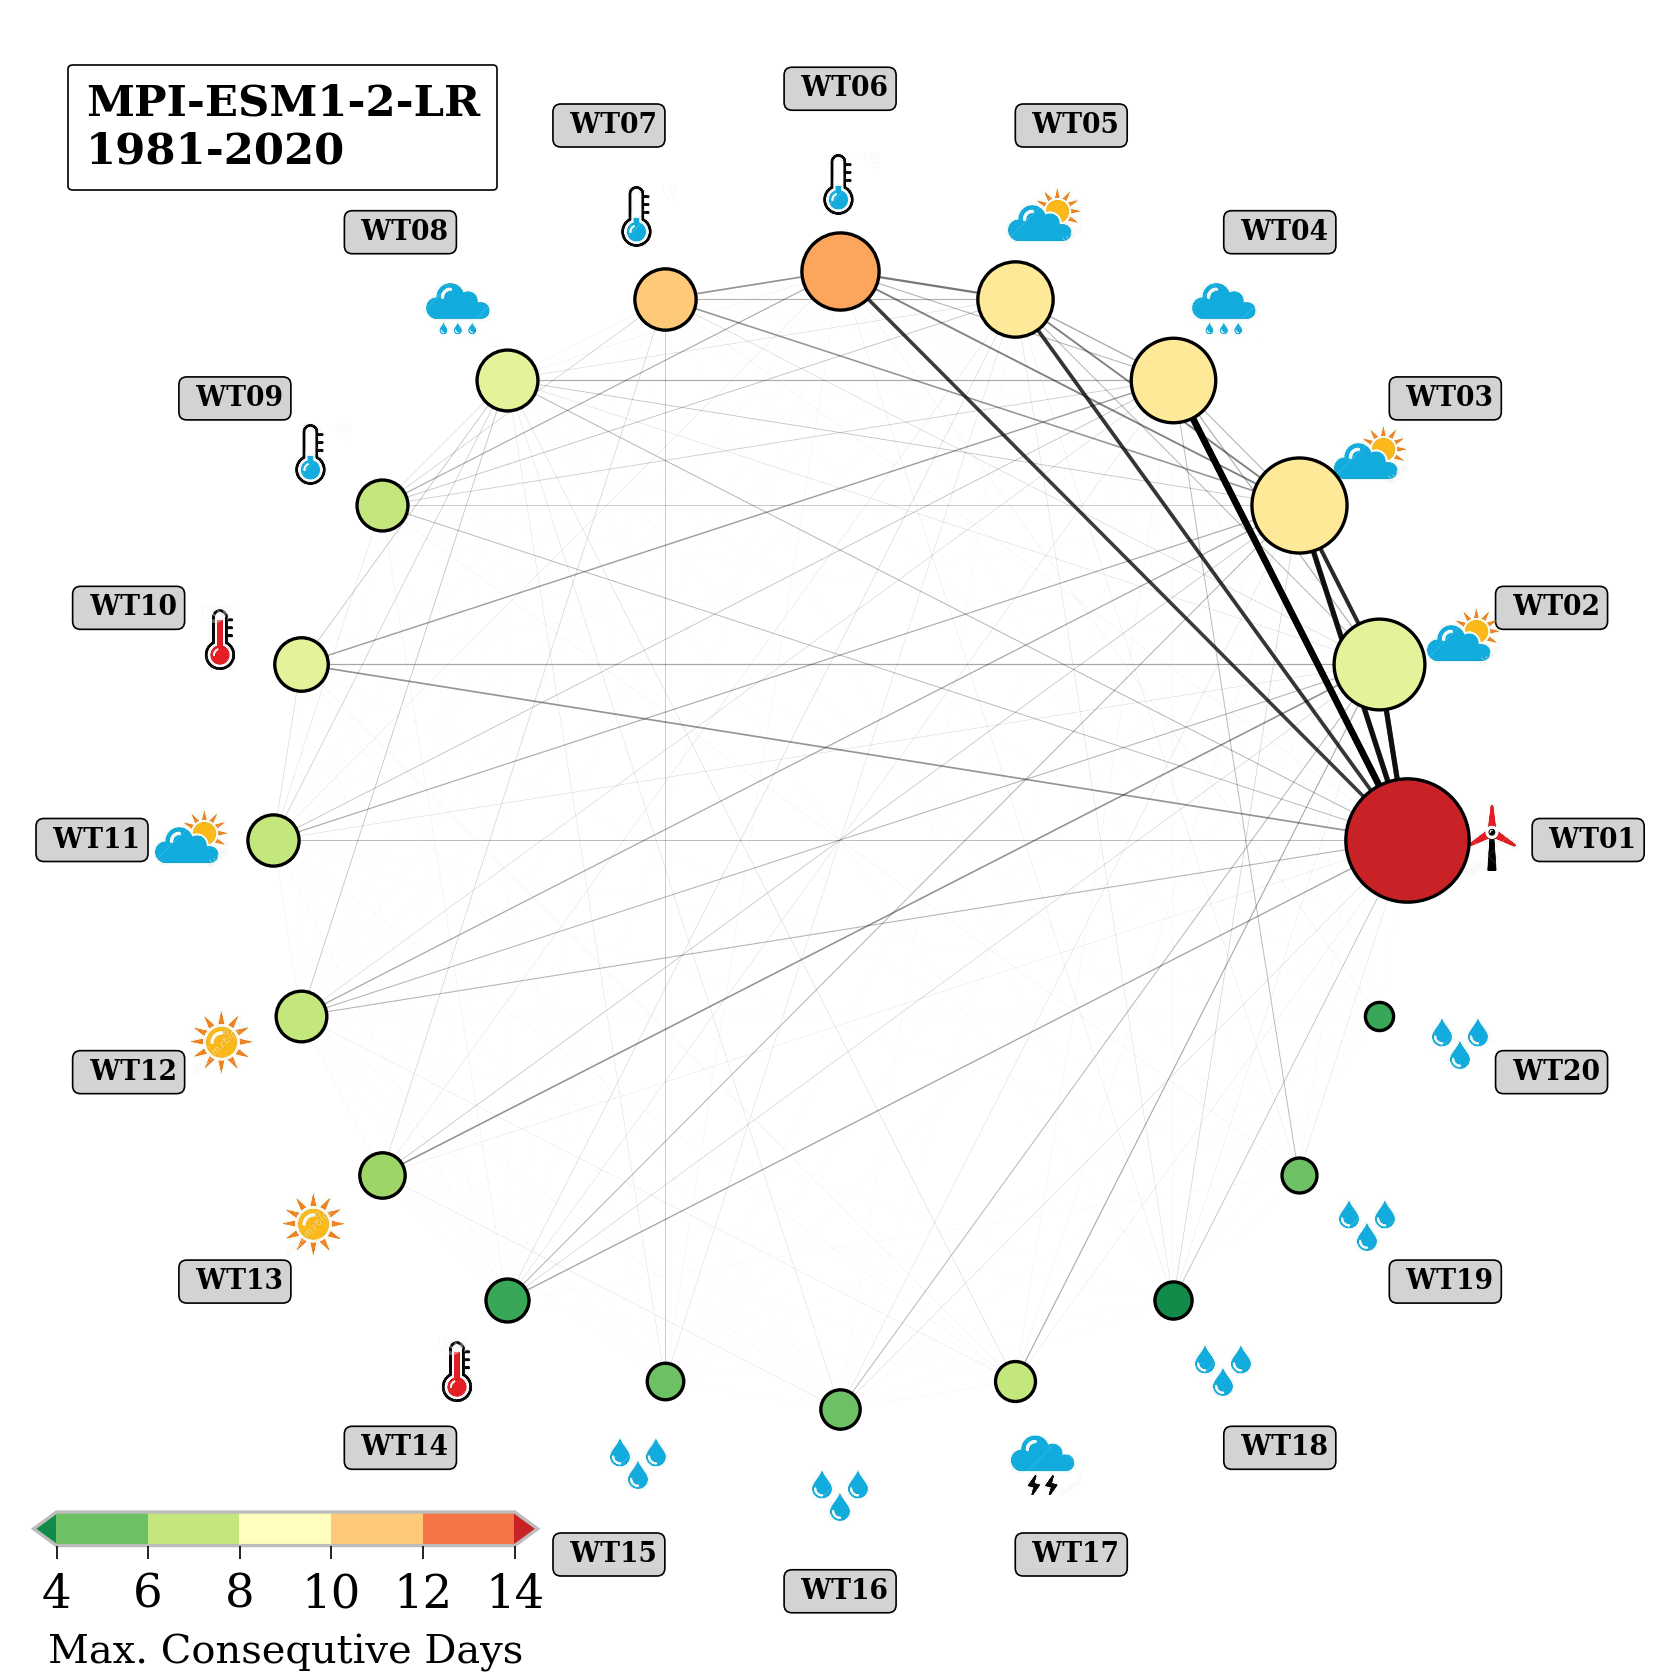
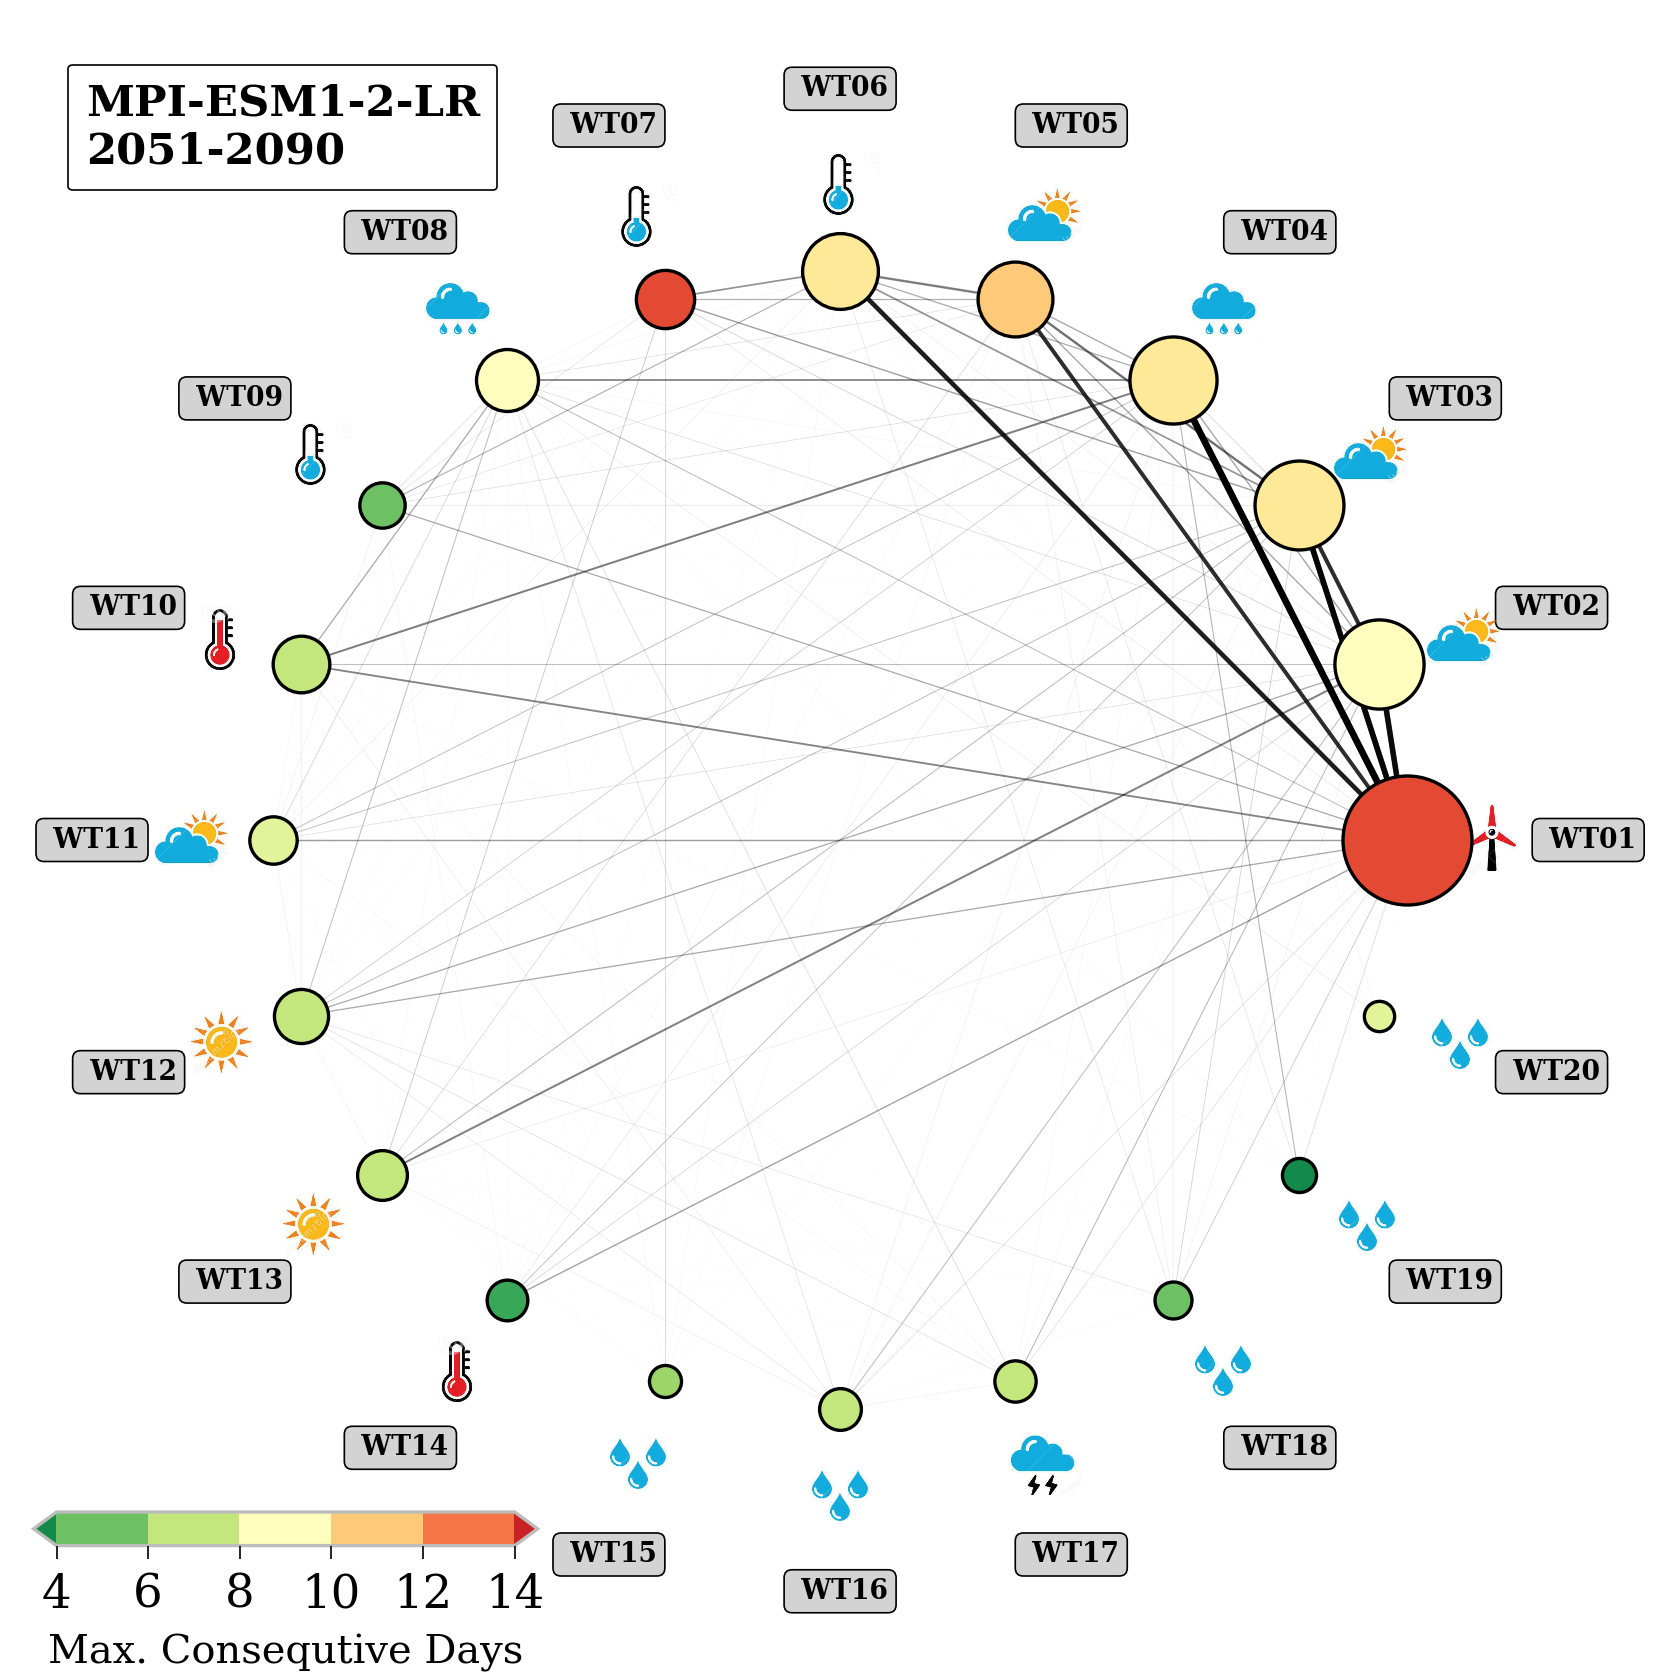
- New dominant weather-types also mean new dominant weather-type transitions. - This network graph visualize the rhythmn of the observed weather variability over Europe. - The size of the scatters are determined by the frequency. - The colors determine the maximum persistency. - And the thickness of the edges determine the transition frequency between two weather-types. - The visual comparison of the graphs indicate how the weather variability has changes.
- The new dominant weather-types are critical weather-types. - Here are shown two distribution of contruibuting weather types for temperature and precipitation intervals in Berlin. - The higher the bars the more weather-types are able to contribute. - On the right end of the distributions are located the extreme values. - The bars are lower. - This means only a few weather-types are retrospectively associated with extreme values. - Temperature: SWZ, TRW, HM, WA - Precipitation: TM, TRM
- By using weather-types the role of of dynamical factors on the long-term development can be analyzed.
- In 2020 we published as study to identify dynamical drivers for change in seasonal temperature and precipitation pattern. - One example for Potsdam is shown here. - First, we calculate the long-term monthly mean temperature and precipitation for each weather-type. - Second, we reconstruct a second time series only based on the time series of weather-types. - Third, for each date we replace the weather-type by the mean temperature and precipitation value. - Finally, cumulated anomalies of the raw time series (black) and the reconstracted time series (red) are compared. - About 10-15% of the warming can be explaine by changes in the weather variability. - For precipitation its higher.
- One critical argument is always the objectiveness. - This expert weather-type classification cannot be fully automated and objectivated. - However, objective methods result in new weather-type classifications.
- Here is shown one example for an objective classification of circulation patterns by using only atmospheric fields of the geopotential height at 500 hPa. - This approach is not limited to Europe. - First each day is compared to each other by similarity measure. - Finally the correlation matrix is analysed by hierarchical clustering for a given number.´
- A possible application is the prediction of weather-types in weather for climate forecasts. - The target value is not the temperature or precipitation, but the weather-type. - From retrospective analysis we know how the weather-types are liked to local weather phenomena.
- This workflow show how to re-identify weather-types in climate model simulations by training a decision tree. - It starts with a training between the atmospheric fields and the weather-types. - In the next step we add non-classified atmospheric fields and test the decision tree. - At the end we obtain a sequence of weather-types for the given climate model.
- Finally, I will show you the comparision of weather variability over Europe in reanalysis and CMIP6 model simulations.
- Next shows the comparison of the weather variability between ERA5 and one CMIP6 member for the period 1981-2020. - The differences are much stronger represented. - WZ is more dominant in this model simulation. - The simulated weather variability in Climate models follows other rules.
- By comparing the weather variability of all models with ranalysis we can possible characterize the performance of individual climate model simulations. - A possible argument for model selection.
- Also changes in the weather variability is lower than expected comparing the future period with the past.
- Based on this knowledge we are able to assess the current weather and weather pattern developement.
- The examples have shown that different shapes and structures of the circulation are associated with characteristic local weather phenomena.
- Here is show the comparison of the weather variability in reanalysis data using the objective classification. - Compared are two period: 1961-1990 to 1991-2020. - The network of edges under present conditions is less caotic.