Example: Climate Diagram Generator for gridded GCM output
Screenshot detail |
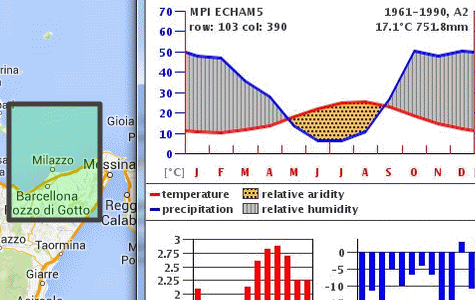
Interactive generator for Walter climate diagrams from global circulation model projections for user-selectable grid cells on the global land mask (0.5° grid cell resolution).
The Climate Diagram Generator allows e.g. to compare projections from different global circulation models, time frames, or emission scenarios.
Available as part of the stimulus module of the Climate Impacts: Global and Regional Adaptation Support Platform (ci:grasp).
Examples
Information systems
Tailored interactive components
|
|