Global Trade and Material Flows
Global production sharing, the rise of emerging economies, and the great trade collapse following the global financial crisis have deeply altered the structure of North-South trade. We analyze the deep reorganization of North-South commodity flows over the two decades between 1995 and 2014 in monetary volume and physical quantity. We find that the traditional narrative of the South providing cheap raw materials to the North while the North exports high value-added manufactures to the South is no longer valid. In fact, South-North trade surpasses North-South trade in unit-price, and the majority of raw materials are imported by the South. The trends leading to this current structure of North-South trade have existed prior to the global financial crisis but were substantially accelerated in the great trade collapse of 2008-2009. The slow growth of trade volume after 2011 stands in stark contrast to uninhibited growth in global trade quantity chiefly due to growing raw material imports of the South. We suggest that more emphasis on quantity data to complement purely monetary analyses of trade are increasingly indispensable to understanding the economic and non-economic effects of trade in areas such as climate change, public health and biodiversity loss.
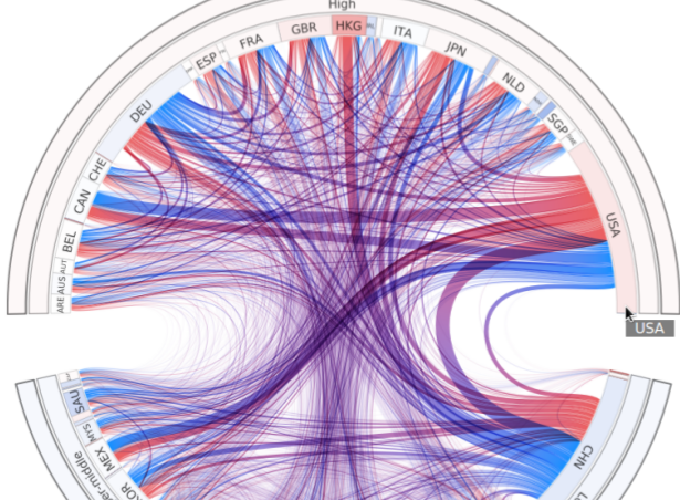
Global trade network 1995-2014 (volume in current USD). Hierarchical clustering of countries by income levels and into North and South. Arc size is proportional to total trade volume (imports and exports) and arc color indicates trade balance (red = monetary trade deficit; blue = monetary trade surplus). Lines between countries represent trade flows from blue (exporter) to red (importer) and are proportional to trade volume.
Global trade network 1995-2014 (Quantity in kg). Hierarchical clustering of countries by income levels and into North and South. Arc size is proportional to total trade quantity (imports and exports) and arc color indicates trade balance (red = monetary trade surplus; blue = monetary trade deficit). Lines between countries represent trade flows from blue (exporter) to red (importer) and are proportional to trade quantity.
See here for publication on visualization details.