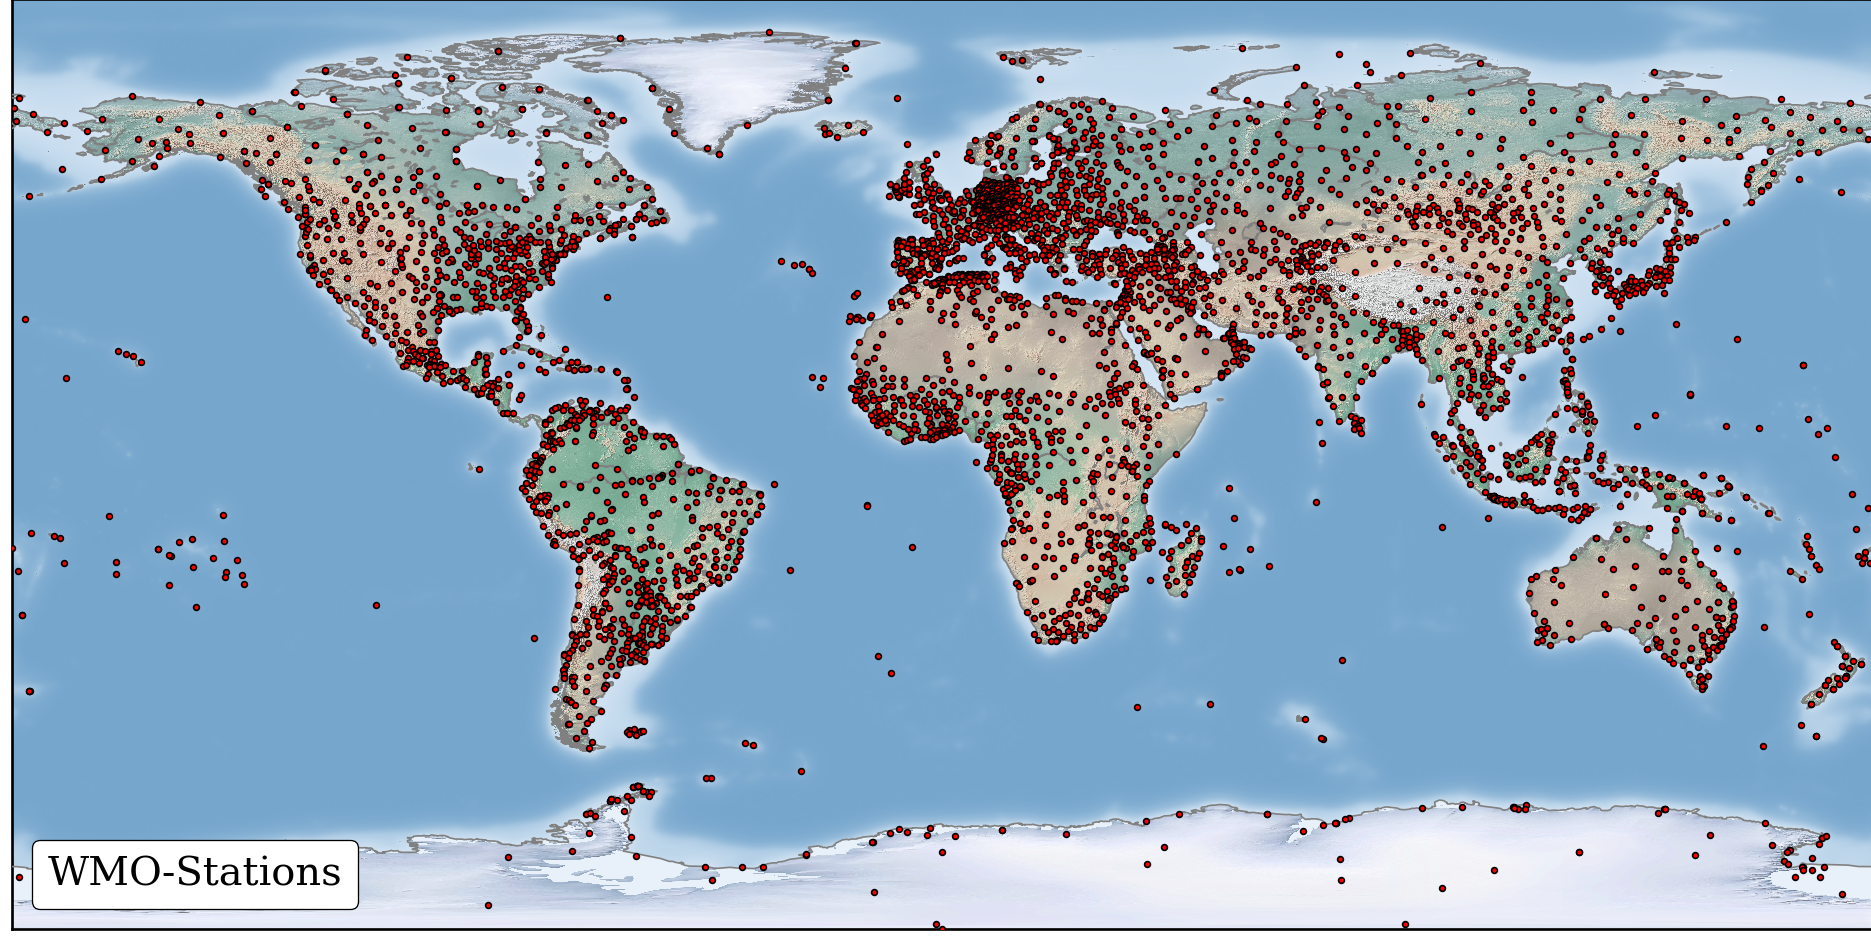
Stations
Global
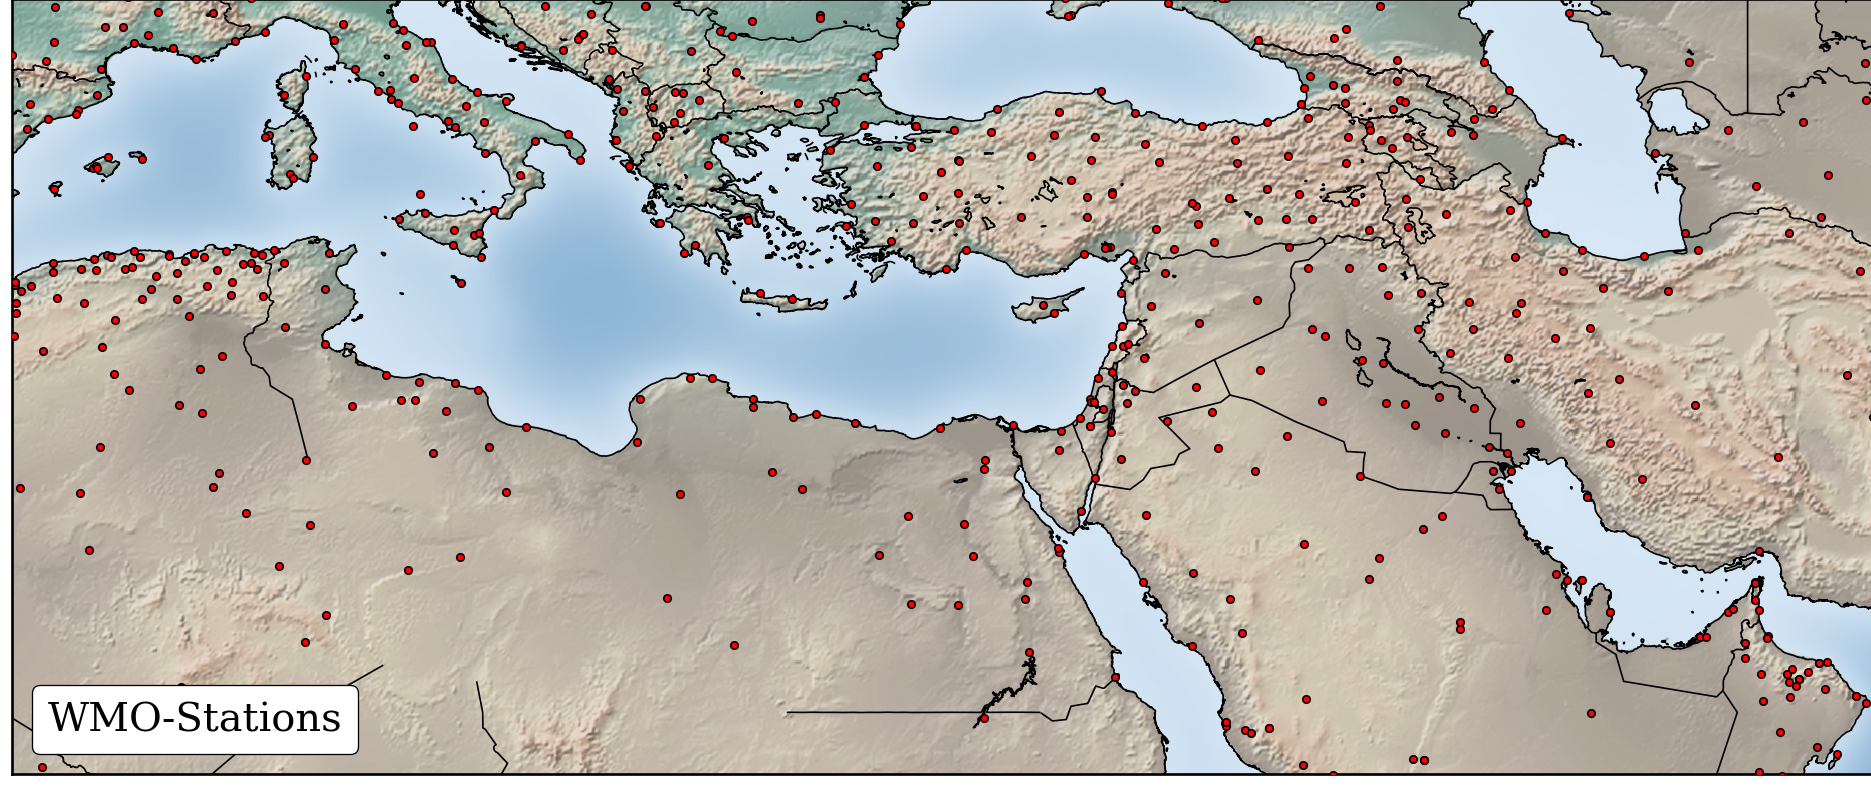
Regional
Climate
Temperature

Precipitation
# -*- coding: utf-8 -*-

import matplotlib
matplotlib.use('Agg') # Must be before importing matplotlib.pyplot or pylab!
import matplotlib.pyplot as plt
from mpl_toolkits.basemap import Basemap,maskoceans
from netCDF4 import Dataset,num2date
from scipy.io import netcdf
import numpy as N
import datetime
from matplotlib.offsetbox import AnchoredText

params = {'legend.fontsize': 8,'font.family': 'serif'}
plt.rcParams.update(params)

plt.style.use('seaborn-talk')
dat = N.genfromtxt('../data/stations_list_CLIMAT_data.txt',skip_header=1,usecols=(2,3),delimiter=';',dtype=float)
ort = N.genfromtxt('../data/stations_list_CLIMAT_data.txt',skip_header=1,usecols=(5),delimiter=';',dtype=str)

print (dat.shape)

no = dat.shape[0]

for box in ['global','med']:

    plt.figure(figsize=(10,6))
    ax = plt.subplot(111)

    if(box=='global'):

         m = Basemap(projection='cyl',llcrnrlat=-90,urcrnrlat=90,llcrnrlon=-180,urcrnrlon=180,resolution='l')
         m.drawcoastlines(color='gray',linewidth=0.5,zorder=20)
         m.shadedrelief()

    if(box=='med'):

         m = Basemap(projection='cyl',llcrnrlat=20,urcrnrlat=45,llcrnrlon=0,urcrnrlon=60,resolution='h')
         m.drawcoastlines(color='k',linewidth=0.5,zorder=20)
         m.drawcountries(color='k',linewidth=0.5,zorder=20)
         m.shadedrelief()

    for o in range(no):

        y,x = m(dat[o,0],dat[o,1])

        if(box=='global'):m.scatter(x,y,s=3,c='r',ec='k',lw=0.5,zorder=30)
        if(box=='med'):m.scatter(x,y,s=5,c='r',ec='k',lw=0.5,zorder=30)

    at = AnchoredText('WMO-Stations',prop=dict(size=12),frameon=True,loc='lower left')
    at.patch.set_boxstyle("round,pad=0.,rounding_size=0.2")
    at.zorder = 40
    ax.add_artist(at)

    plt.savefig('./img/stations_%s.png'%box,dpi=240,transparent=False,bbox_inches='tight',pad_inches=0)
#40250; Rwaished; 32.50; 38.20; 683; Jordan
#40255; Irbed; 32.55; 35.85; 616; Jordan
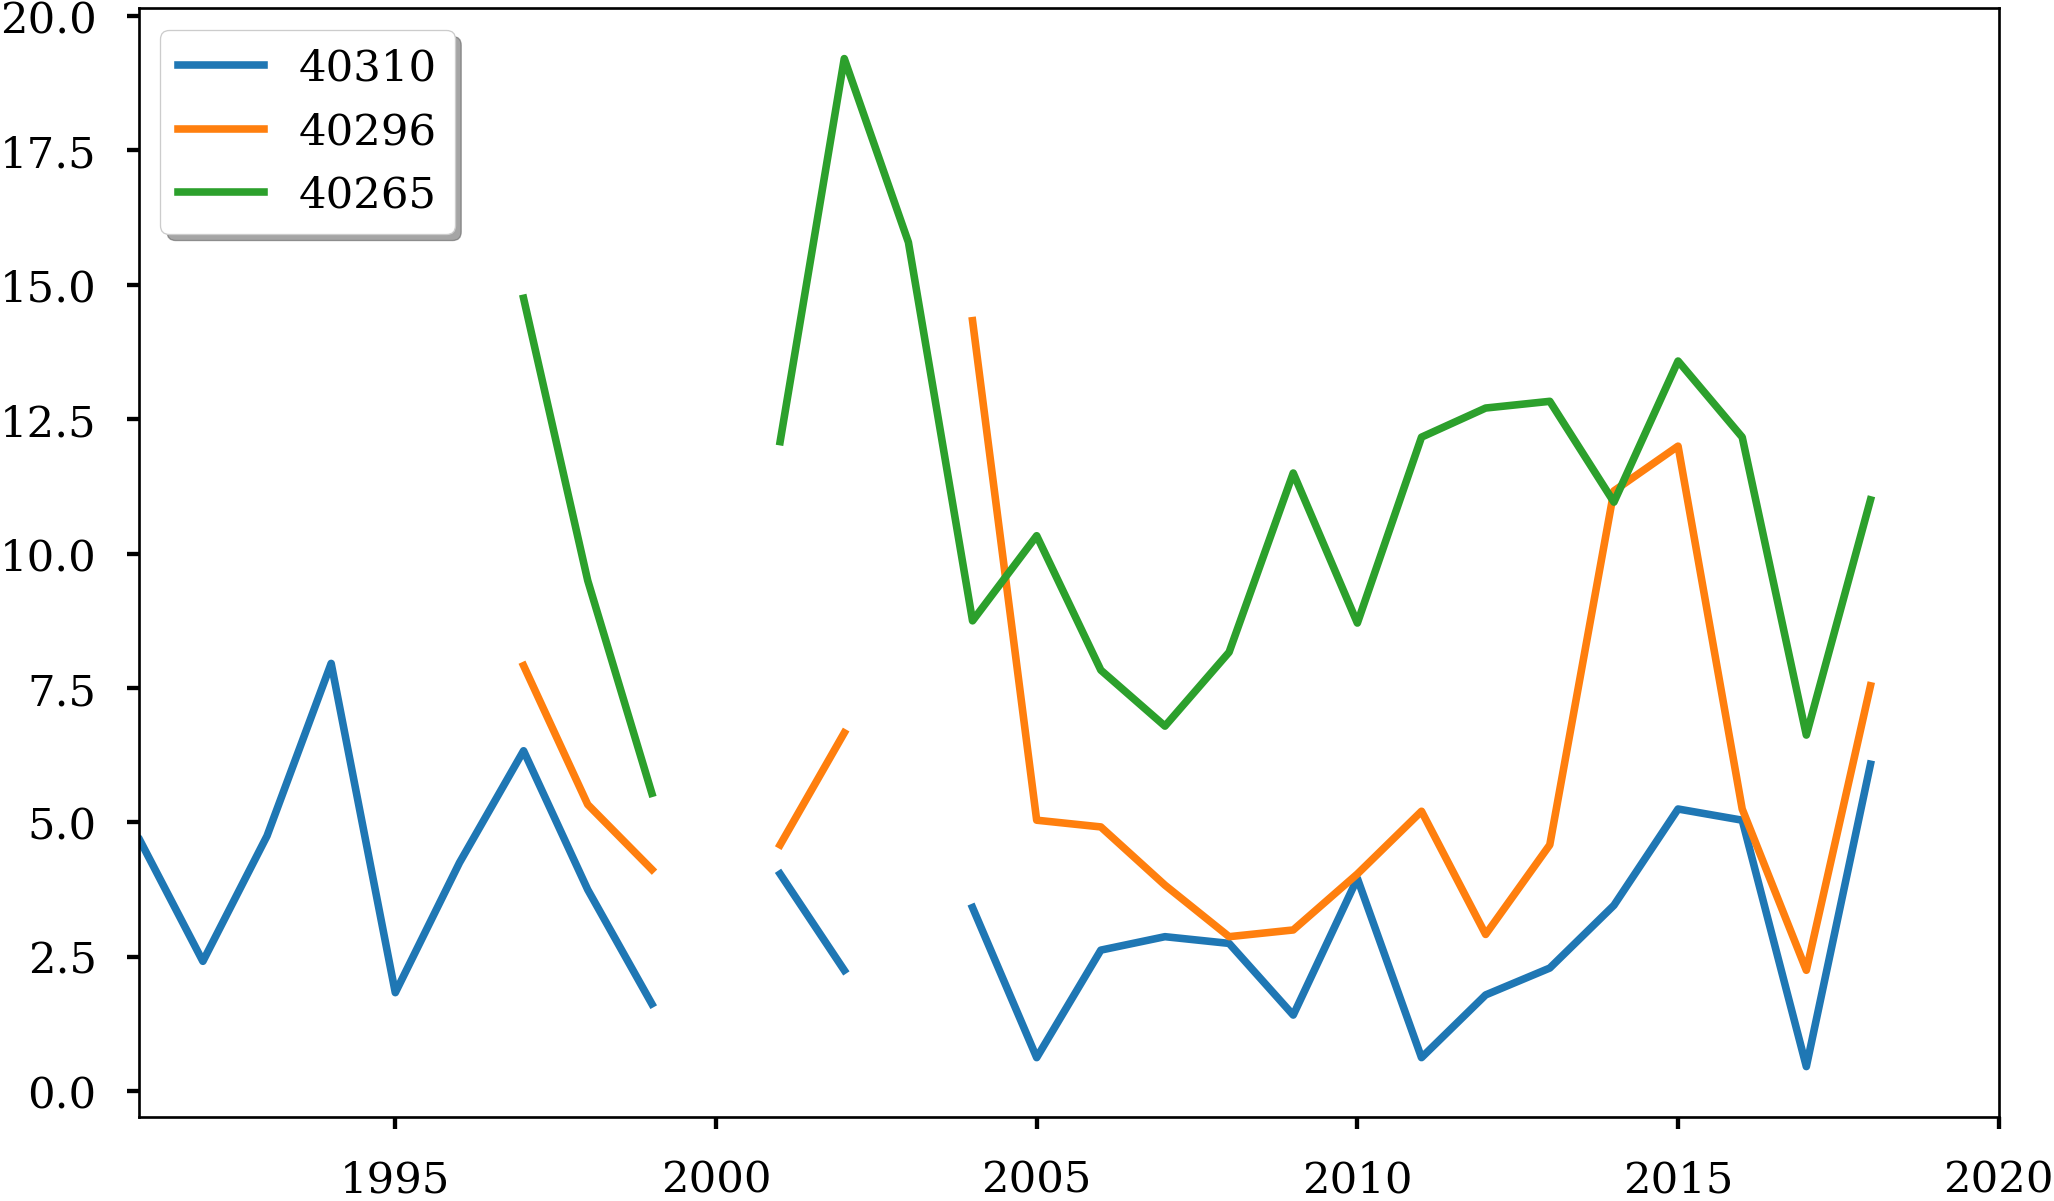
#40265; Mafraq; 32.37; 36.25; 683; Jordan
#40270; Amman Airp.; 31.97; 35.99; 779; Jordan
#40296; Ghor Safi; 31.03; 35.47; -350; Jordan
#40310; Ma'an Airport; 30.17; 35.78; 1069; Jordan
mon = ['Jan','Feb','Mrz','Apr','Mai','Jun','Jul','Aug','Sep','Okt','Nov','Dez']
nm = len(mon)
ids = ['40310','40296','40265']
for ip in ['air_temperature_mean','precipitation_total']:
plt.figure(figsize=(10,6))
ax = plt.subplot(111)
for id in ids:
dat = N.genfromtxt('../data/%s/%s.txt'%(ip,id),names=True,delimiter=';',dtype=None)
jo = dat['Jahr']
nj = dat.shape[0]
tmp = N.zeros((nj,nm),float)
for j in range(nj):
for m in range(nm):
tmp[j,m] = dat[mon[m]][j]
plt.plot(jo,N.mean(tmp,1),label=id)
plt.xlim(1991,2020)
plt.legend(loc=2,shadow=True)
plt.savefig('./img/%s.png'%ip,dpi=240,transparent=False,bbox_inches='tight',pad_inches=0)