import sys
import os
import matplotlib
matplotlib.use('Agg') # Must be before importing matplotlib.pyplot or pylab!
import matplotlib.pyplot as plt
import matplotlib.pyplot as P
from mpl_toolkits.basemap import Basemap,shiftgrid,maskoceans
from matplotlib.path import Path
from matplotlib.patches import PathPatch
#from osgeo import gdal
import numpy
import shapefile
from netCDF4 import Dataset
import numpy as N
from netCDF4 import Dataset, num2date,date2num
from scipy import signal,stats
import matplotlib as mpl
import matplotlib.colors as colors
from datetime import datetime
from mpl_toolkits.axes_grid1.inset_locator import inset_axes
from matplotlib.offsetbox import AnchoredText
from skimage.metrics import structural_similarity as ssim

plt.style.use('seaborn-talk')

params = {      'legend.fontsize': 8,\
                'font.family': 'serif',\
                }
plt.rcParams.update(params)

def ma(a,n=3):
    ret=N.cumsum(a,dtype=float)
    ret[n:]=ret[n:]-ret[:-n]
    return ret[n-1:]/n
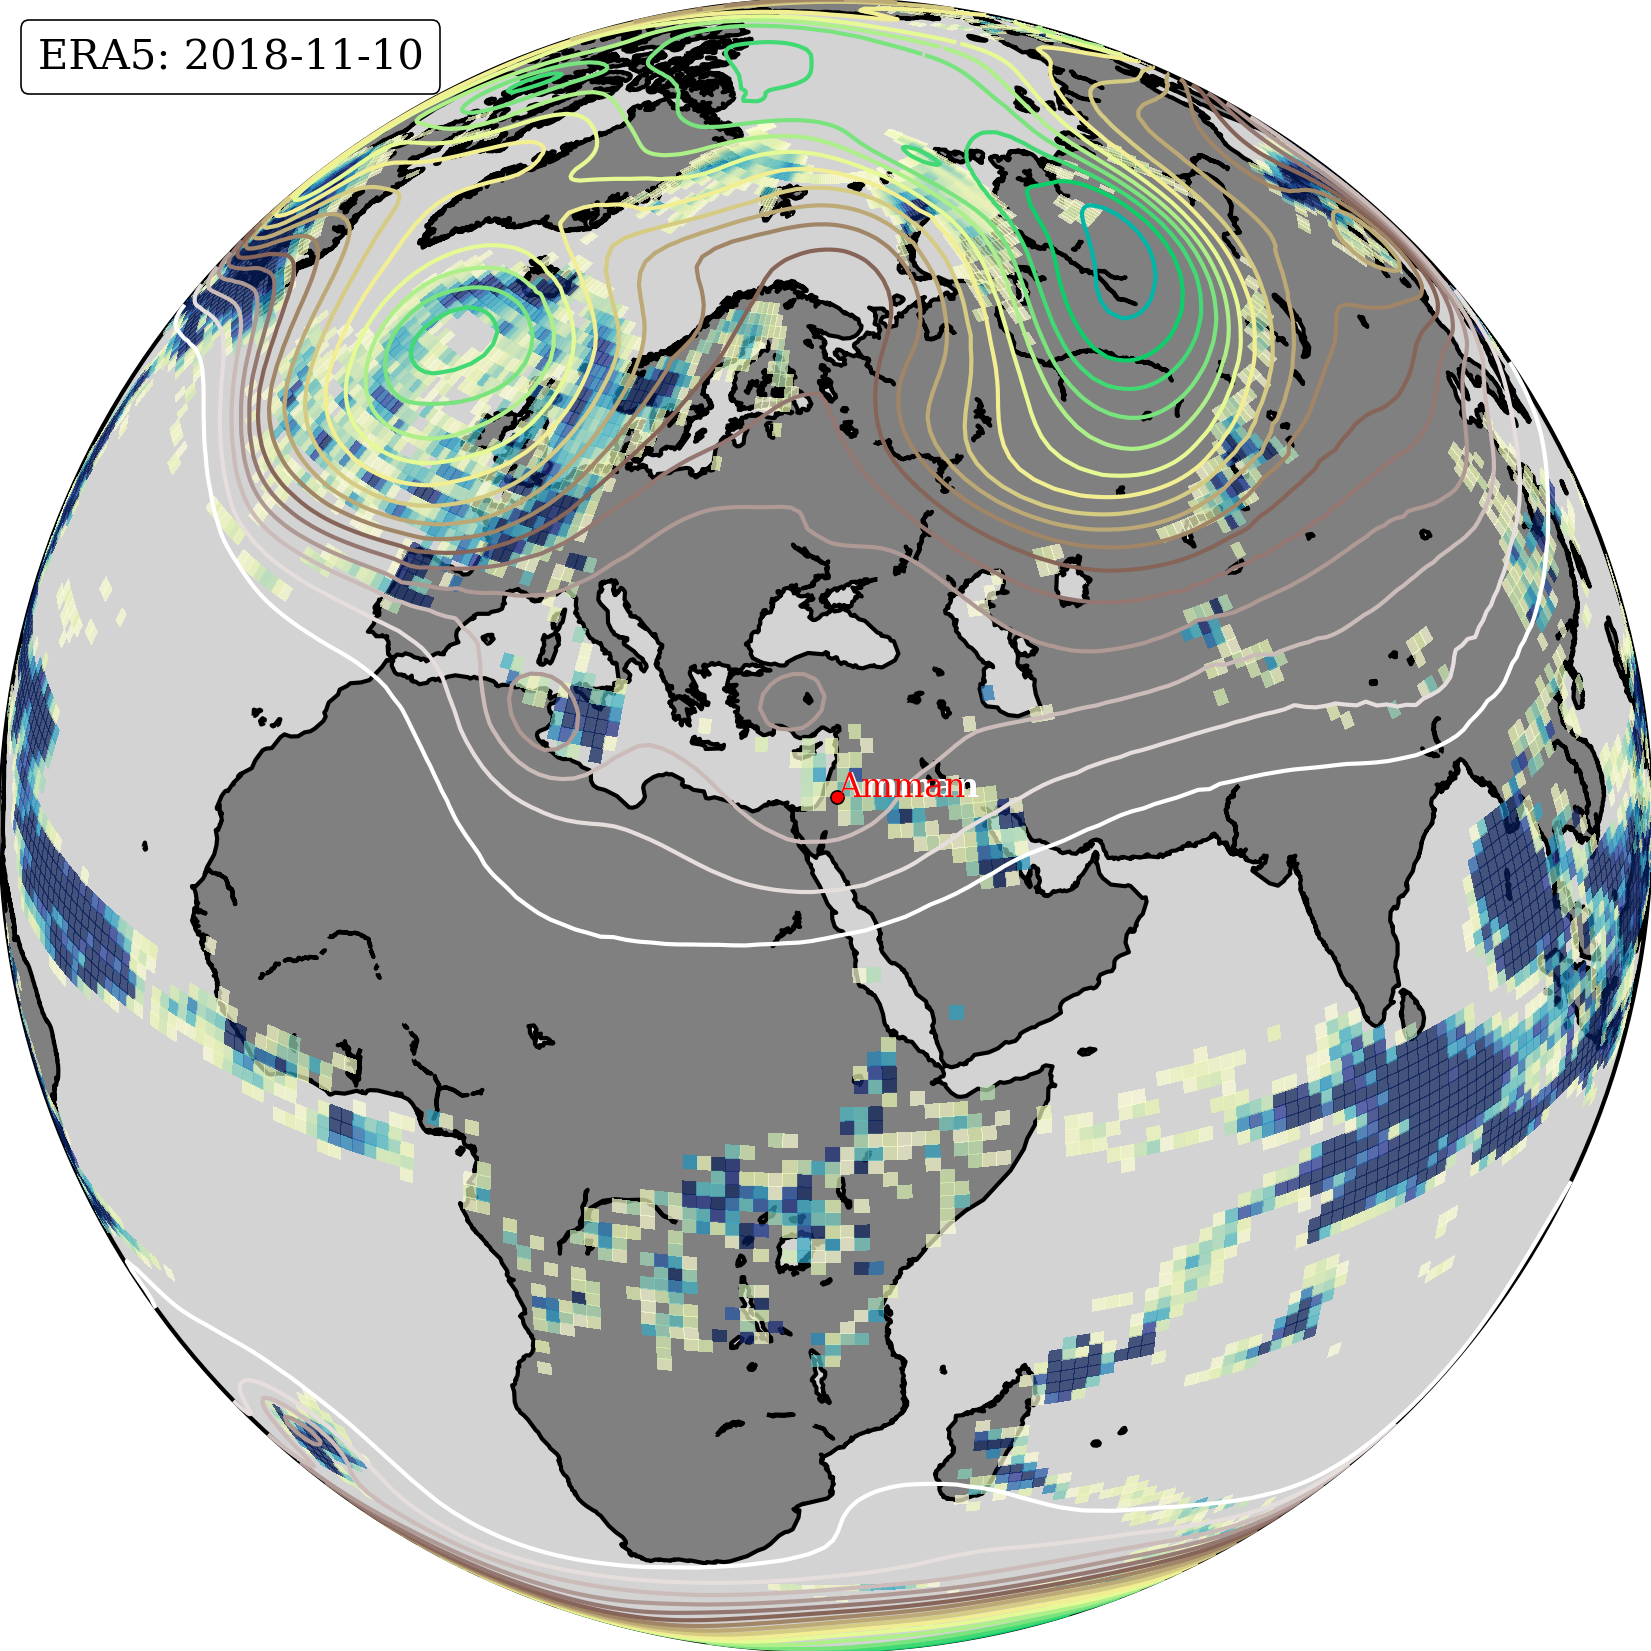
for date in ['2018-11-10']:

    file = '../data/era5/nied_%s.nc'%(date)

    nc = Dataset(file,'r')

    lon = N.array(nc.variables['lon'][:]);nx = len(lon)
    lat = N.array(nc.variables['lat'][:]);ny = len(lat)
    prc = N.array(nc.variables['pr'][:])*24*3600

    nc.close()

    file = '../data/era5/z500_%s.nc'%(date)

    nc = Dataset(file,'r')

    lon = N.array(nc.variables['lon'][:]);nx = len(lon)
    lat = N.array(nc.variables['lat'][:]);ny = len(lat)
    phi = N.array(nc.variables['zg500'][:])

    nc.close()

    P.figure()
    ax = P.subplot(111)

    m = Basemap(projection='ortho',lon_0=35,lat_0=30,resolution='l')

    m.drawmapboundary(fill_color='lightgray')
    m.fillcontinents(color='gray',lake_color='lightgray')

    m.drawcoastlines(color='k')
    #m.bluemarble()

    xx,yy = m(*N.meshgrid(lon,lat))

    ax.contour(xx,yy,phi[0,:,:],levels=N.linspace(47000,57000,20),cmap=P.get_cmap('terrain'),linewidths=1.0,zorder=10)

    prc[prc<10.] = N.nan

    ax.pcolor(xx,yy,prc[0,:,:],cmap=plt.get_cmap('YlGnBu'),vmin=10,vmax=50,zorder=5,alpha=0.7)

    at = AnchoredText('ERA5: %s'%(date),prop=dict(size=10),frameon=True,loc='upper left')
    at.patch.set_boxstyle("round,pad=0.,rounding_size=0.2")
    at.zorder = 20
    ax.add_artist(at)

    xx,yy = m(35.930359,31.963158)
    m.scatter(xx,yy,s=10,c='r',ec='k',zorder=15)
    P.text(xx,yy,'Amman',fontsize=8,weight='bold',color='w',zorder=14)
    P.text(xx,yy,'Amman',fontsize=8,color='r',zorder=15)

#    xx,yy = m(35.444832,30.328960)
#    m.scatter(xx,yy,s=20,c='r',ec='k')
#    P.text(xx,yy,'Petra',fontsize=10)

    plt.savefig('./img/%s.png'%(date),dpi=300,transparent=True,bbox_inches='tight',pad_inches=0.0)