Introduction into regional climate scenarios and sensitivities of heavy rainfall indicators
All slides are available at
[www.pik-potsdam.de/~menz/CapTainRain/Webinar](http://www.pik-potsdam.de/~menz/CapTainRain/Webinar)

Christoph Menz
RDII
Potsdam Institut for Climate Impact Research


### Table of Content
- Introduction - Climate Change
- Climate Change from Global Climate Models Persepctive
- Climate Change from Regional Climate Models Persepctive
- Brief Introduction to Bias Adjustment
- Projected Precipitation Change in Jordan


# Introduction - Climate Change
## Assessment Reports
### WG1: Physical Science Basis
1990
1995
2001
2007
2013
2021


414P
588P
893P
1007P
1552P
3175P
### Temperature
### Precipitation


Global mean annual changes 1971-2100 vs. 1971-2000
IPCC AR5: CMIP5
IPCC AR6: CMIP6
RCP2.6/SSP1-2.6: Sustainable development
RCP8.5/SSP5-8.5: Fossil-fueled development
### Temperature
### Precipitation


Global mean annual changes 2071-2100 vs. 1971-2000
IPCC AR6: CMIP6
SSP5-8.5: Fossil-fueled development
# Climate Change from Global Climate Models Perspective


\begin{equation}
\nonumber
\rho \frac{d \vec{\mathbf{v}}}{d t} = - \vec \nabla p + \rho g
-2\vec{\mathbf{\Omega}} \times (\rho \vec{\mathbf{v}}) - \vec \nabla \overleftrightarrow{\mathbf{t}}
\end{equation}
\begin{equation}
\nonumber
\frac{d \rho}{d t} = - \rho \vec \nabla \vec{\mathbf{v}}
\end{equation}
\begin{equation}
\nonumber
\rho \frac{d q^x}{dt} = - \vec \nabla \vec{\mathbf{J}}^x + I^x
\end{equation}
\begin{equation}
\nonumber
\rho \frac{d e}{d t}=-p \vec \nabla \vec{\mathbf{v}} - \vec \nabla
(\vec{\mathbf{J}_e} + \vec{\mathbf{R}})+\epsilon
\end{equation}
## Development of Global Models

#### RCP: Representative Concentration Pathways
#### SSP: Shared Socioeconomic Pathways
- Scenarios representing greenhouse gas concentrations in the atmosphere
- Narratives for future socio-economic evolution
- No adaptation/mitigation to climate change
- Similar in CMIP5 and CMIP6
- van Vuuren et al. (2011) and Riahi et al. (2017)

Historical
Observations
RCP2.6
SSP1-2.6
Peak around 2040 (490ppm)
400ppm in 2100
RCP4.5
SSP2-4.5
moderate increase
650ppm in 2100
RCP8.5
SSP5-8.5
strongest increase
1370ppm in 2100
## Temperature vs Precipitation
2071-2100 vs. 1971-2000 - annual mean
Global

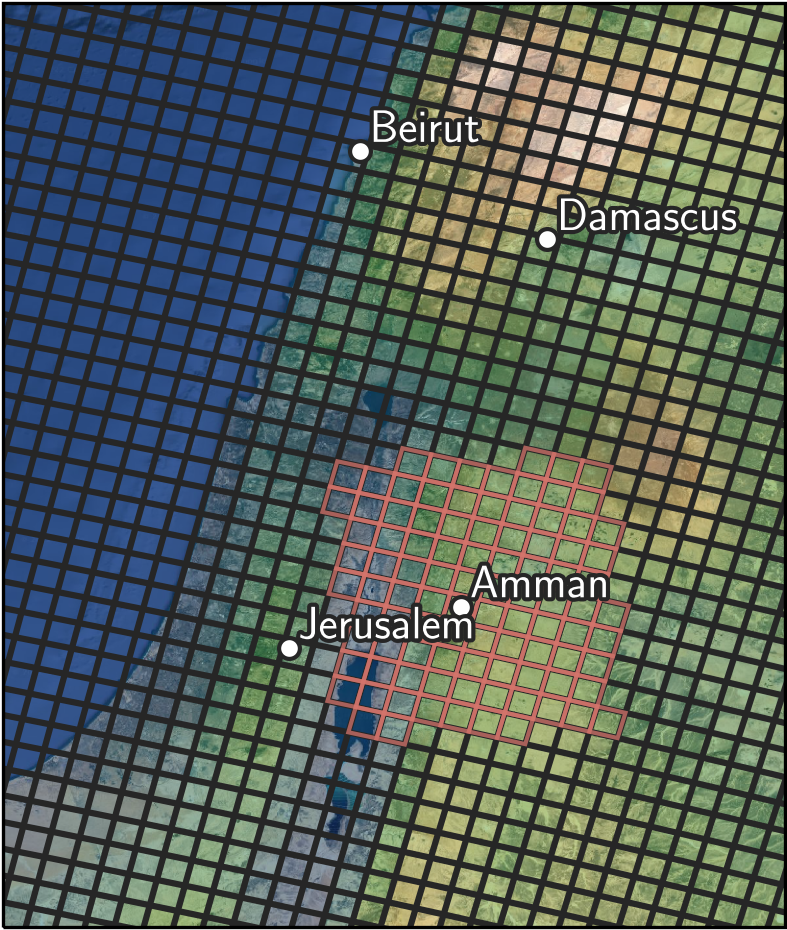
Amman

## Distribution of Precipitation


# Climate Change from Regional Climate Models Persepctive

## Evolution of daily mean precipitation
## GCM
## RCM
### CORDEX
- Coordinated Regional Downscaling Experiment
- Description for 14 Regions accross globe
- Most Regions in different resolution (~50km, ~25km and ~12.5km)


#### Boundary Problem
- RCMs are limited area models driven at boundaries by external forcing (usually Reanalysis or GCM data)
- Discrepancy in spatial and temporal resolution of RCM and driver
- Leads to boundary effects
- Boundary zone coupling:
\begin{equation}
\nonumber
\psi^{n+1} = \psi^* - \alpha_b (\psi^* - \psi^{n+1}_b)
\end{equation}
Davis (1976, 1983)

Spatial: ~250km → ~25km
Temporal: ~6h → ~0.1h
#### Which should be used for Jordan?
#### Which should be used for Jordan?
RCP 2.6
RCP 4.5
RCP 8.5
CORDEX-EUR44CORDEX-EUR11
~50km~12km
1118
2117
2637
CORDEX-MNA44CORDEX-MNA22
~50km~25km
1-
41
42
CORDEX-MED11
~12km
-
-
-

# Model BIAS
### Temperature Bias - Annual - Ensemble Median - 1981-2010
### CORDEX-MNA44
### CORDEX-MNA22
### CORDEX-EUR11


### Precipitation Bias - Annul - Ensemble Median - 1981-2010
### CORDEX-MNA44
### CORDEX-MNA22
### CORDEX-EUR11


### Temperature and Precipitation Bias Seasonality


1971-2005
Observation: E-OBS v19.0e
37 CORDEX-EUR11 Models
- Underestimation of wet season (NDJFM) temperature and precipitation
- Overestimation of dry season (JJAS) temperature and precipitation
- Precipitation bias up to 1/5 in wet season and twice pre and post dry season observation
# Brief Introduction to Bias Adjustment
## Example of Model Bias
JJA Temperatures, Bangladesh

## Example of Model Bias
JJA 1971-2000, Amman
## Example of Model Bias


2021-2050
2071-2100
Boberg and Christensen (2012)
## Bias Adjustment - Workflow


#### Chosen Bias Adjustment Method
- ISIMIP3BASD method used for bias adjustment
- Parametric quantile mapping
- Trend preserving

1981-2010
Annual - Ensemble Mean
### Temperature Bias
### CORDEX-MNA44
### CORDEX-MNA22
### CORDEX-EUR11
#### non-adjusted


#### adjusted


1981-2010
Annual - Ensemble Mean
### Precipitation Bias
### CORDEX-MNA44
### CORDEX-MNA22
### CORDEX-EUR11
#### non-adjusted


#### adjusted


1971-2005
Observation: E-OBS v19.0e
37 CORDEX-EUR11 Models
MPI-ESM1-2-HR
CCLM 4.8.17
- 1971-2000

# Projected Precipitation Change
- Global climate model projections of
- CMIP 5: up to 42 simulations
- CMIP 6: up to 41 simulations
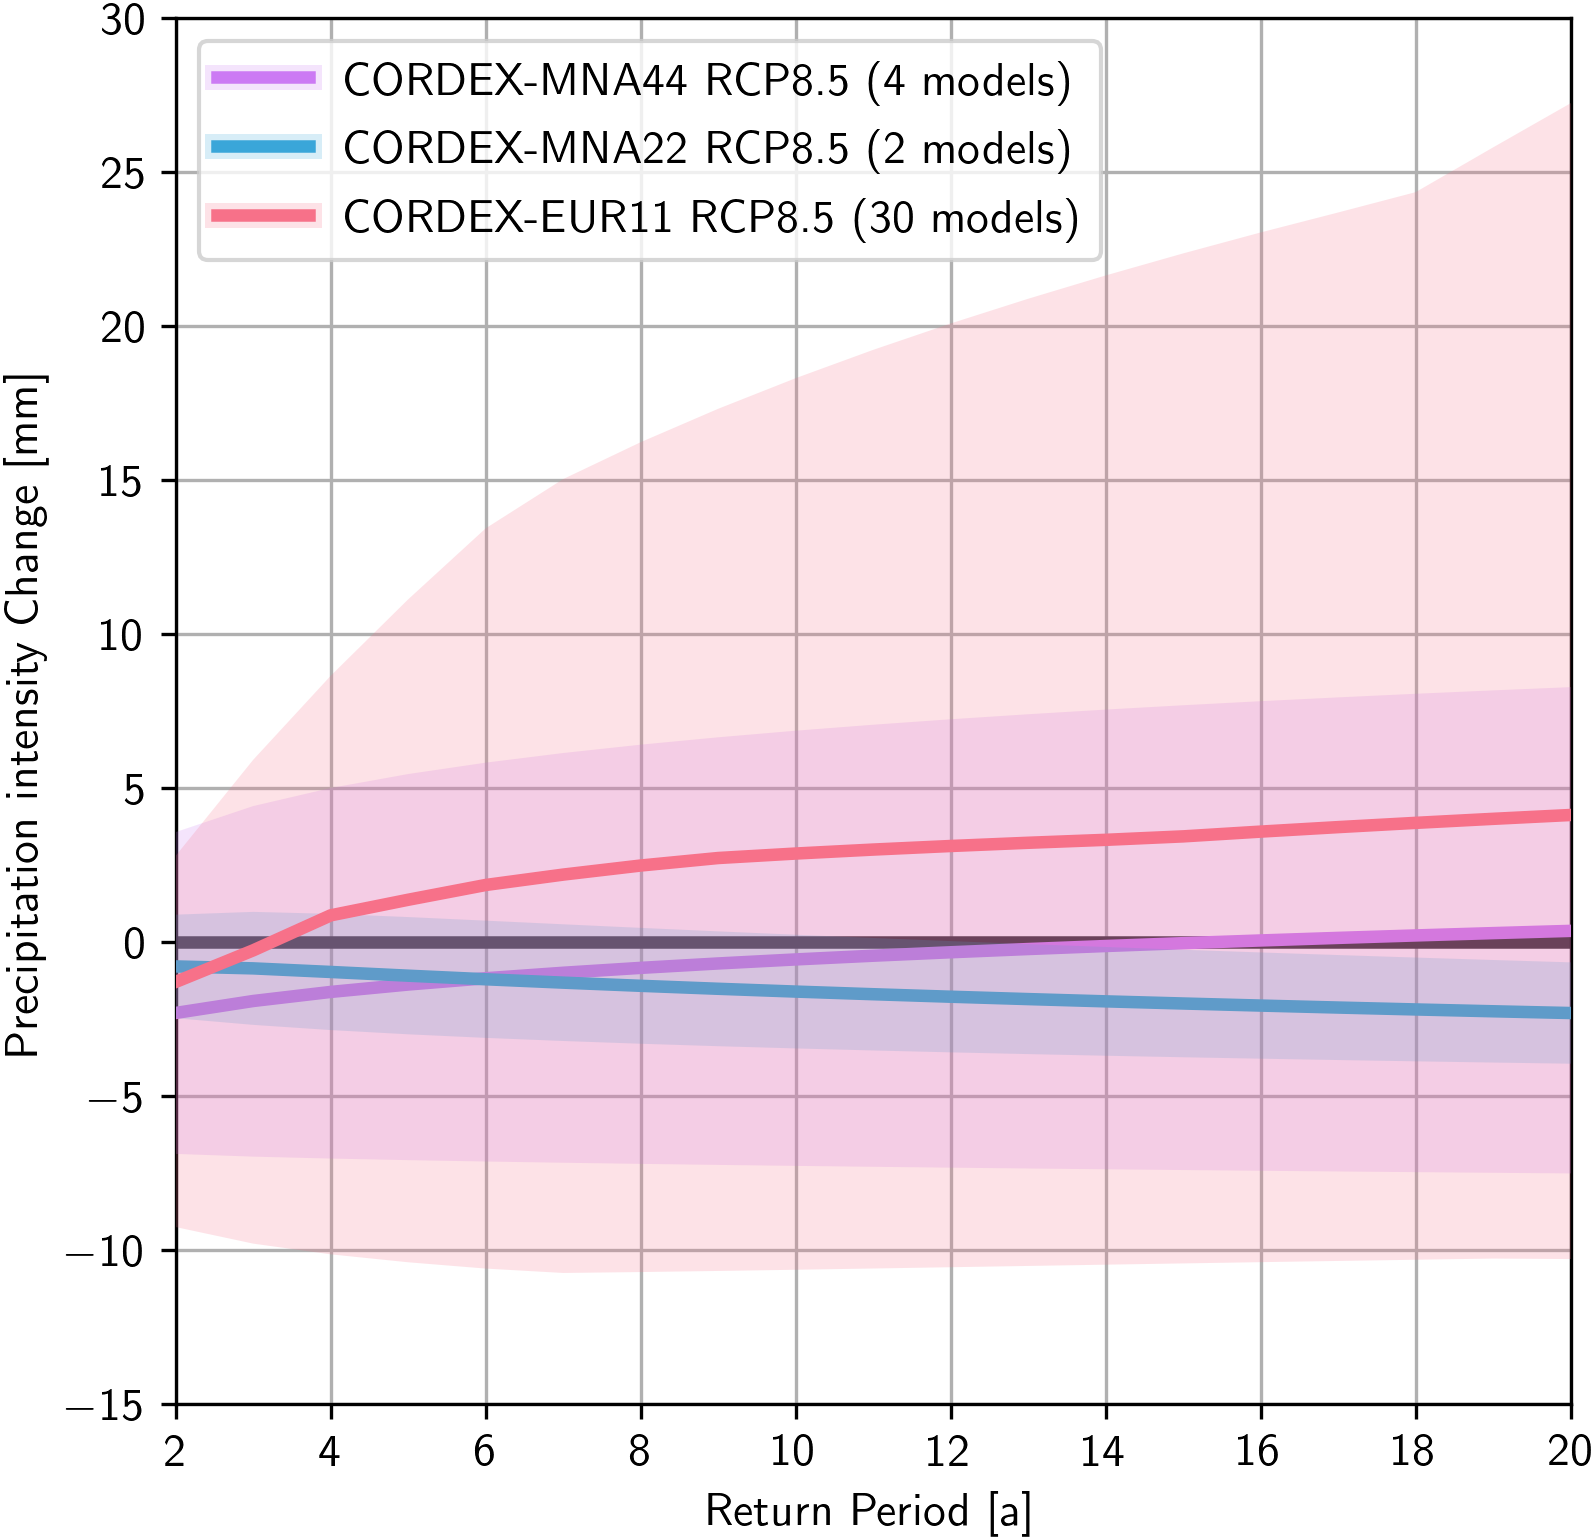
- Regional climate model projections of
- CORDEX-MNA44: up to 4 simulations
- CORDEX-MNA22: up to 2 simulations
- CORDEX-MNA44: up to 37 simulations
- Bias adjustment using ISIMIP3BASD
- Projections until 2100 under
- RCP 8.5 - Fossil-fueled development
- Focus on Amman and surrounding area
- Focus on ETCCDI indices


### Climate Change Signal - NDJFM
2071 - 2100 vs. 1981 - 2010
CMIP5 RCP 8.5
CMIP6 SSP5-8.5
CORDEX-MNA44 RCP 8.5
CORDEX-MNA22 RCP 8.5
CORDEX-EUR11 RCP 8.5
Temperature


Precipitation


#### Precipitation Events
---
number of rainy days (RR1)
≥1mm
---
number of vey wet days (R20mm)
≥20mm
---
NDJFM
---
Projection period
2071-2100
Reference period
1981-2010
---
90% significance level
CORDEX-MNA44
CORDEX-MNA22
CORDEX-EUR11
(≥1mm) # rainy days


days (≥20mm) # very wet days


#### Precipitation Events
---
Seasonal maximum precipitation (RX1day)
---
Reference period
1981-2010
NDJFM


JJAS


#### Generalized extreme value distribution
---
Annual maximum precipitation
Empirical distribution fitted to GEV probability density
---
Projection period
2071-2100
Reference period
1981-2010
---
Standardized pdf
\begin{equation}
f(s;\xi) = \begin{cases} \exp(-s) \exp\Bigl(-\exp(-s)\Bigr) \& ~~ \text{ for } ~~ \xi = 0 \newline {} \newline
\Bigl(1+\xi s\Bigr)^{-(1+1/\xi)} \exp\Bigl(-(1+\xi s)^{-1/\xi}\Bigr) \& ~~ \text{ for } ~~ \xi \neq 0 ~~ \text{ and } ~~ \xi \, s > -1 \newline {} \newline
0 & ~~ \text{ otherwise. } \end{cases}
\end{equation}

## Climate Change Summary - Amman
Variable
Unit
JJAS
NDJFM
1981-2010
2011-2040
2041-2070
2071-2100
1981-2010
2011-2040
2041-2070
2071-2100
Temperature
${}^\circ\,\mathrm{C}$
$\mathbf{26.6}$
$\color{red}{\mathbf{1.3}}$
$\color{red}{\mathbf{2.9}}$
$\color{red}{\mathbf{4.8}}$
$\mathbf{12.5}$
$\color{red}{\mathbf{1.0}}$
$\color{red}{\mathbf{2.3}}$
$\color{red}{\mathbf{3.9}}$
Precipitation
$\mathrm{mm}/\mathrm{d}$
$\mathbf{0.01}$
$\color{blue}{ 0.025}$
$\color{blue}{ 0.039}$
$\color{blue}{ 0.032}$
$\mathbf{2.02}$
$\color{red}{-0.089}$
$\color{red}{-0.265}$
$\color{red}{\mathbf{-0.508}}$
Rainy Days
$\#$
$\mathbf{0.1}$
$\color{blue}{ 0.06}$
$\color{blue}{ 0.04}$
$\color{blue}{ 0.02}$
$\mathbf{33.7}$
$\color{red}{-0.43}$
$\color{red}{\mathbf{-0.98}}$
$\color{red}{\mathbf{-1.61}}$
R10mm
$\#$
$\mathbf{0.03}$
$\color{blue}{0.08}$
$\color{blue}{0.08}$
$\color{blue}{0.07}$
$\mathbf{10.3}$
$\color{red}{-0.6}$
$\color{red}{-1.6}$
$\color{red}{\mathbf{-2.9}}$
R20mm
$\#$
$\mathbf{0.03}$
$\color{blue}{ 0.013}$
$\color{blue}{ 0.017}$
$\color{blue}{ 0.015}$
$\mathbf{2.92}$
$\color{blue}{ 0.001}$
$\color{red}{-0.062}$
$\color{red}{-0.167}$
RX1day
$\mathrm{mm}/\mathrm{d}$
$\mathbf{1.4}$
$\color{blue}{1.7}$
$\color{blue}{2.3}$
$\color{blue}{1.8}$
$\mathbf{30.1}$
$ \color{blue}{\hphantom{-}1.2}$
$ \color{blue}{\hphantom{-}0.5}$
$\color{red}{-1.5}$
RX5day
$\mathrm{mm}/5\mathrm{d}$
$\mathbf{1.4}$
$\color{blue}{2.5}$
$\color{blue}{3.6}$
$\color{blue}{2.8}$
$\mathbf{63.8}$
$\color{blue}{\hphantom{-}0.4}$
$\color{red}{-3.2}$
$\color{red}{-8.8}$
# The End
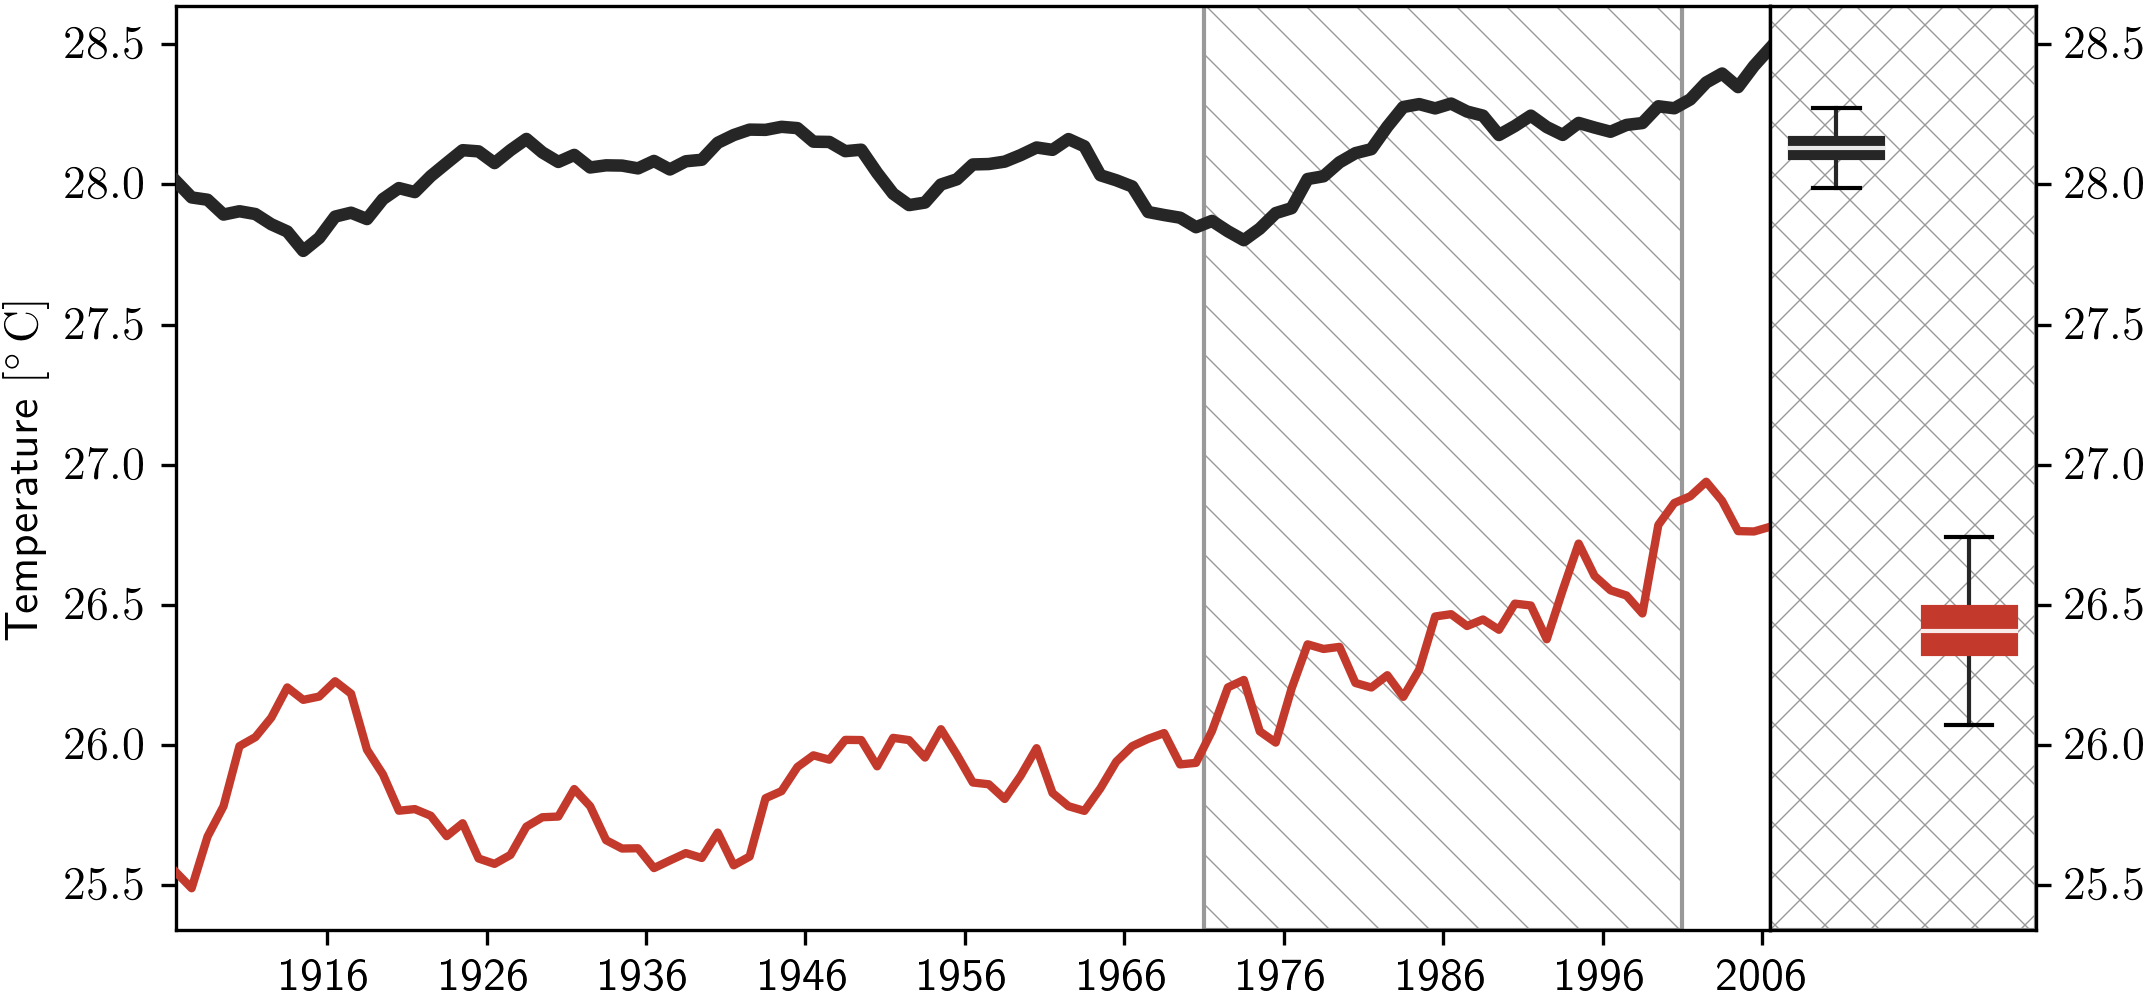
#### Temperature Climatology

1971-2000
Observation: E-OBS v24.0e
#### Precipitation Climatology

1971-2000
Observation: E-OBS v24.0e

## Observation Data

## Observation vs. Reference dataset

**Tarim Basin**


## Multivariate bias adjustment
- Physical/Statistical dependencies between variables ignored so far (only univariate distributions adjusted)
- How can we adjust multivariate distributions:
- Conditional quantile mapping for single bins (Piani and Haerter, 2012)
- Random rotations of variable-vector combined with univariate quantile mapping (Cannon, 2017)
**Simulation**
**Observation**


## Variance Inflation
- Bias adjustment $\neq$ downscaling (Maraun, 2013)
- Bias adjustment can lead to **variance inflation** in case of large scale gaps
- Former local extremes are transfered to every station within a grid cell


Maraun (2013)
## Further issues
- Statistical adjustment **NO** physical reasoning
- We assume that $g(x_\mathrm{sim})$ does **not change in time**
- Seperate bias adjustement for different season, month or day of year might be necessary
- Bias adjustment can change temporal structure of timeseries on different scales
- Naive QM can distort climate trend
- Bias adjustment using conditional resampling of huge ensemble (Sippel et al., 2017)
## How to choose a suitable bias adjustment?
- Which biases and how large (data exploration)?
- What is important in your impact assessment (goal exploration)?