Projected changes in meteorological drought risk under future climate change scenarios
(Part II)

Christoph Menz
RDII
# Outline - Recap - Change in dry spell duration and frequency - Change in dry spell intensity - Conclusion
# Recap
## Recap - Based on Regional Climate Model - **RCM** - simulations published within CORDEX-EUR11 framework - Numerical models solving **physical equations of motion** on a limited domain with boundary information from global climate models - Bias Adjusted using trend preserving empirical/parametric quantile mapping


- Timeframe covered: **1971-2100** - Temporal resolution: **daily** - Spatial Resolution: **0.11°** (≈**12.5km**) - Variables: **Temperature** (minimum, average and maximum) and **Precipitation** - Total model simulations: **72**

RCP2.6: **18** RCP4.5: **17** RCP8.5: **37**
## Climate Change Projections
Temperature
--- 2071-2100 vs. 1981-2010 --- RCP8.5 ---
Precipitation
Evapotranspiration
--- 37 simulations --- significance level \begin{align} \alpha = 0.3 \end{align} ---
Climatic Water Balance

Change in dry spell duration and frequency

## Change in Number of Dry Days
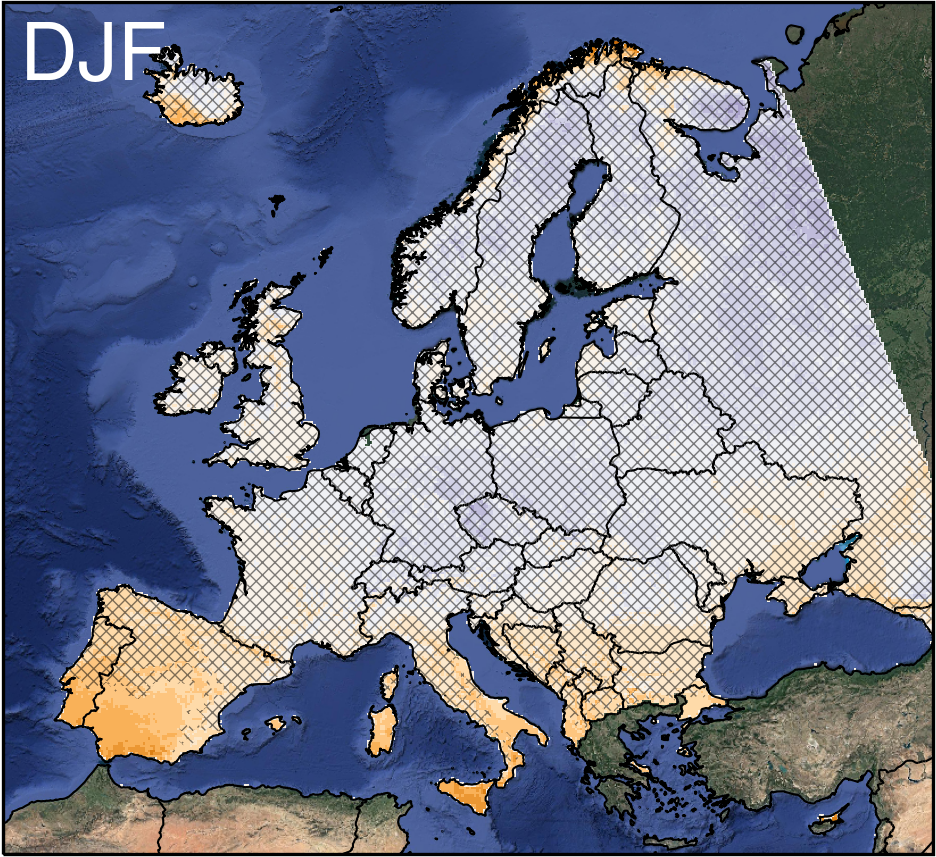
- At least 7 consecutive days with precipitation below 1.0mm
- **North to south gradient** resembling precipitation change
- **Dry regions** and **seasons** get **drier**

--- 2071 - 2100 vs. 1981 - 2010 RCP8.5 significance level $\hphantom{a}\alpha = 0.3$ ---

## Dry Spell Return Period
Annual 1981-2100

Change in dry spell intensity

## Change in SPEI
- Standardized Precipitation Evapotranspiration Index
- **North to south gradient**, similar to dryDays and precipitation change
- **Longer time scales** show **stronger change**

--- 2071 - 2100 vs. 1981 - 2010 RCP8.5 significance level $\hphantom{a}\alpha = 0.3$ ---
## SPEI change in time - Development of SPEI for a single grid point - Smooth time series with decadal running window average - Determine threshold, when SPEI turn negative

--- 1986-2096 RCP8.5 37 simulations ---
85 percentile
100 x resampled
## SPEI change in time
- Decade when ensemble **SPEI** turns **negative** on **average**
- Most of **Mediterranen** turns **negative SPEI** within the **first half of the 21st century**
- **Central** and **northern Europe** still in climatological **positive SPEI** state
- **Longer time scale SPEI** appears **earlier** and propagates **faster** northward

--- 85% threshold significance level $\alpha = 0.15$ ---

RCP2.6
RCP4.5
RCP8.5
3-months
6-months
12-months
24-months
## SPEI future change vs. observed change

3-months
6-months
12-months
24-months
2071-2100
vs.
1981-2010
Projections
## SPEI future change vs. observed change

3-months
6-months
12-months
24-months
2001-2010
vs.
1981-2000
Observations
2071-2100
vs.
1981-2010
Projections

Conclusion

## Conclusion
- **Temperature** (0.8 to 5.3K) and **evapotranspiration** (0.04 to 0.38mm/d) will **increase significantly** throughout Europe until 2100
- **Precipitation increases in north** (-0.2 to 0.3mm/d) and **decreases in south**, increase in north compensates for increase in evapotranspiration
- All drought indices show similar pattern as precipitation change
- Number of **dry days increases in south** (up to 14 days), especially in dry seasons
- **Extreme drought events increase only slightly** in Mediterranen (5-10 days), return periods roughly halve
- **SPEI increases significantly** (down to -1.0/-1.3/-1.6/-2.1 for 3/6/12/24 months) in southern Europe, turning climatilogical negative in the first half of the 21st century
- **SPEI decrease at higher time scale** show **stronger decrease**, **propagestes further north** and **changes earlier**


Backup

## Drought pattern during plant development
## Extreme dry years
Variable
Time Frame
E-OBS
Model Ensemble
pr
1971-2020
1/13
1/16
cwb
1971-2020
1/25
1/58
pr
1971-2100
1/13
1/15
1971-2020
1971-2020
1971-2100