Source Data:
Observed fingerprint of a weakening Atlantic Ocean overturning circulation
Caesar, L., Rahmstorf, S., Robinson, A. , Feulner, G. and Saba, V. :
Observed fingerprint of a weakening Atlantic Ocean overturning circulation.
CM2.6 Model data:
The time series
CM2.6_CONTROL_1860_SST_MONTHLY_GLOBAL_121_200.nc and
CM2.6_2xCO2_SST_MONTHLY_GLOBAL_121_200.nc as well as the
AMOC time series CM2.6_AMOC_RAPID.xlsx
for both runs can be received from V. Saba (vincent.saba@noaa.gov).
Observational data:
All observational data sets are publicly available from the sources listed in Table 1 in the Extended Data Section, download the data at the resolution listed in the Table.
CMIP5 model data:
Linear AMOC index and AMOC strength trend
Post-processed Data
Grid of the subpolar gyre region
Grid of the Gulfstream region
AMOC index HadISST data
Gulfstream index HadISST data
From the CM2.6 and the HadISST time monthly time series produce the annual mean data, e.g. using the climate data operator via
cdo mulc,12 -divdpy -yearavg -muldpm CM2.6_2xCO2_SST_MONTHLY_GLOBAL_121_200.nc CM2.6_2xCO2_SST_ANNUAL_GLOBAL_121_200.nc
Calculate the linear SST slope for each month over the complete time series for both the 2xCO2 run and the control run, e.g. for January via
cdo trend –selmonth,1 CM2.6_2xCO2_SST_MONTHLY_GLOBAL_121_200.nCM2.6_2xCO2_SST_ _January_GLOBAL_121_200_intercept.nc CM2.6_2xCO2_SST_January_GLOBAL_121_200_slope.nc
Figure 1
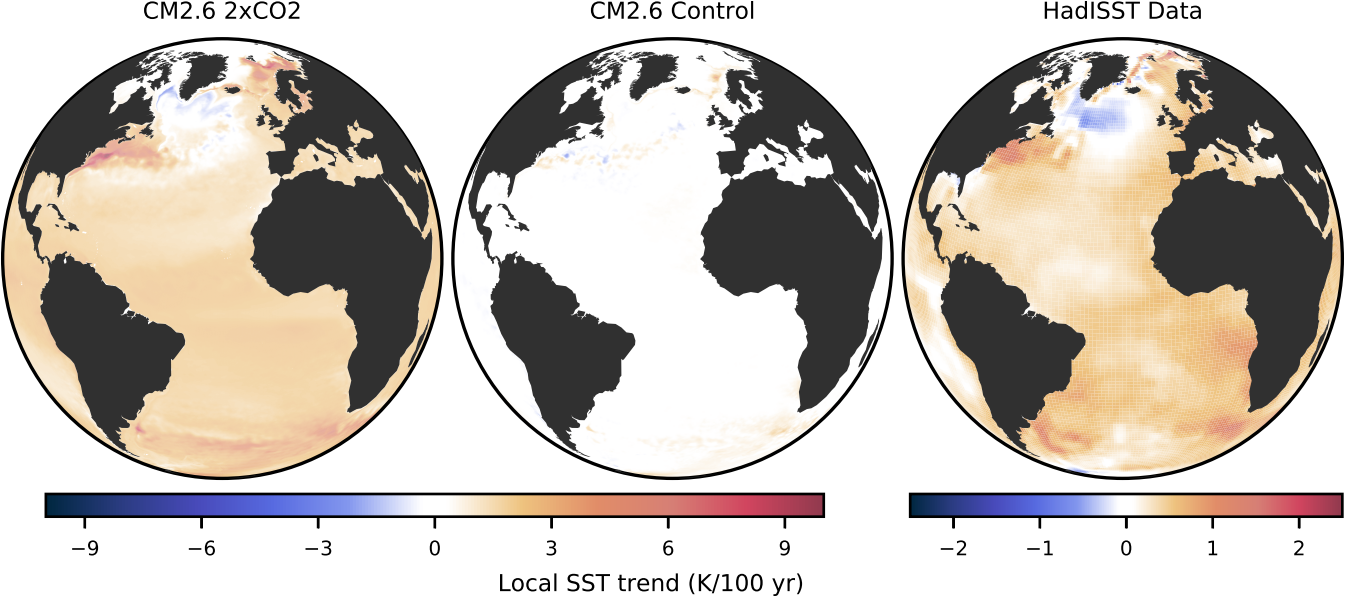
Fig.1: Shown are the linear slopes of the Nov-May season for the 80-year CM2.6 2xCO2 run (CM2.6_2xCO2_SST_*_GLOBAL_121_200_slope), the CM2.6 control run (CM2.6_CONTROL_1860_SST_*_GLOBAL_121_200_slope) and the HadISST data for 1870-2016 (HadISST_sst_*_slope). To recreate, calculate the mean of the monthly, linear SST trends (weighted with the length of the month), to get the linear trend of the Nov-May season.
Figure 2
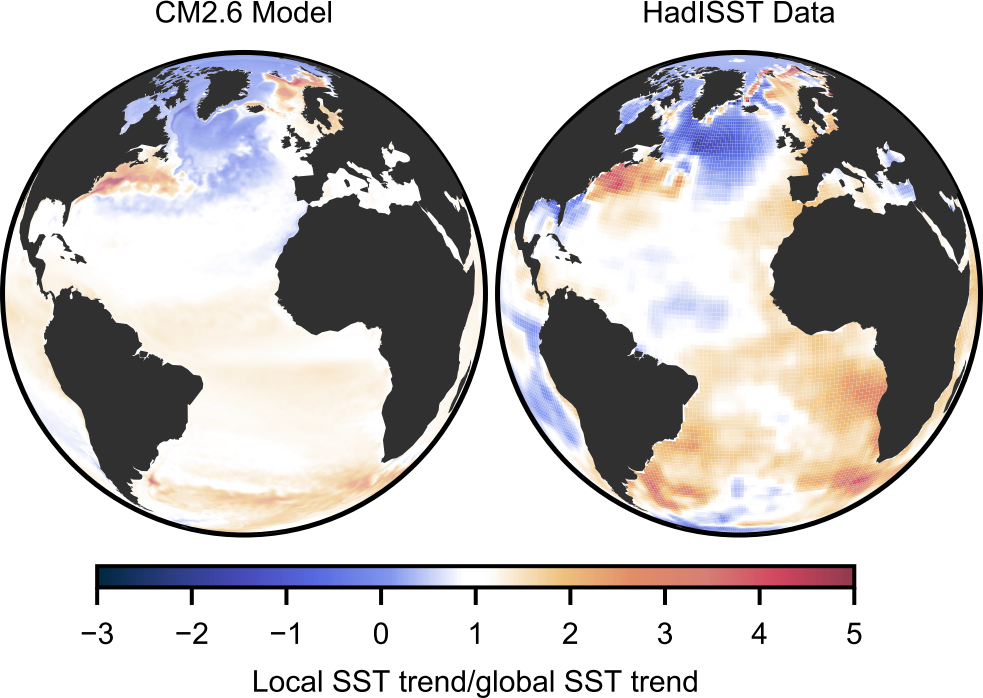
Fig.2: Shown are the linear slopes of the Nov-May season for the 80-year CM2.6 2xCO2 run (CM2.6_2xCO2_SST_*_GLOBAL_121_200_slope) and the HadISST data for 1870-2016 (HadISST_sst_*_slope) divided by the respective global mean SST trend. To recreate, calculate the mean of the monthly, linear SST trends (weighted with the length of the month), to get the linear trend of the Nov-May season and then divide by the respective global mean.
Figure 3
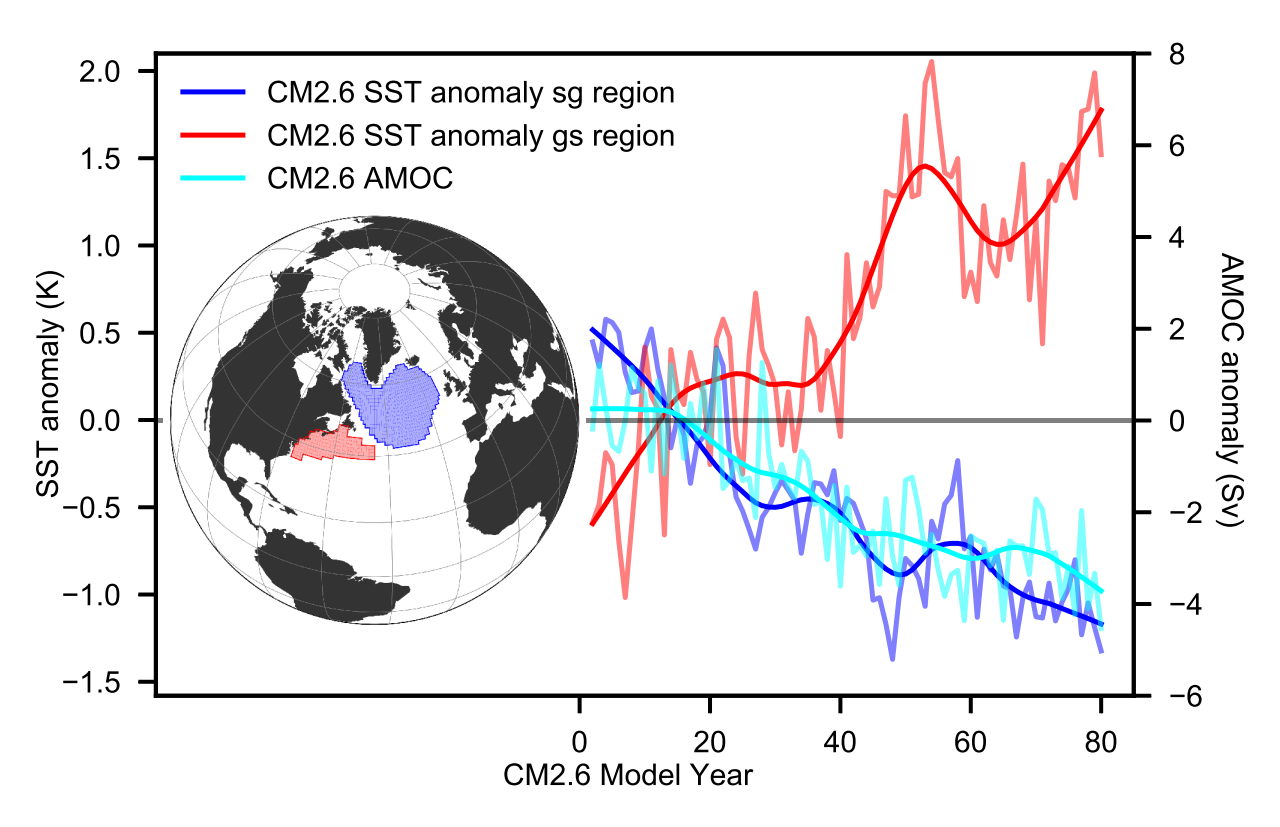
Fig.3: Shown are the time series of the SST anomaly in the subpolar gyre region, the SST anomaly in the Gulfstream region (create from CM2.6_2xCO2_SST_MONTHLY_GLOBAL_121_200.nc) and the AMOC time series (CM2.6_AMOC_RAPID.xlsx) for the 2xCO2 run of the CM2.6 model. The anomalies are received by subtracting the corresponding time series of the CM2.6 control run (create from CM2.6_CONTROL_1860_SST_MONTHLY_GLOBAL_121_200.nc). The inlet shows the subpolar gyre region (sg_grid.txt) and the Gulfstream region (gs_grid.txt). The files give the mean coordinates of the 1° lat.x1° lon. grid cells.
Figure 4
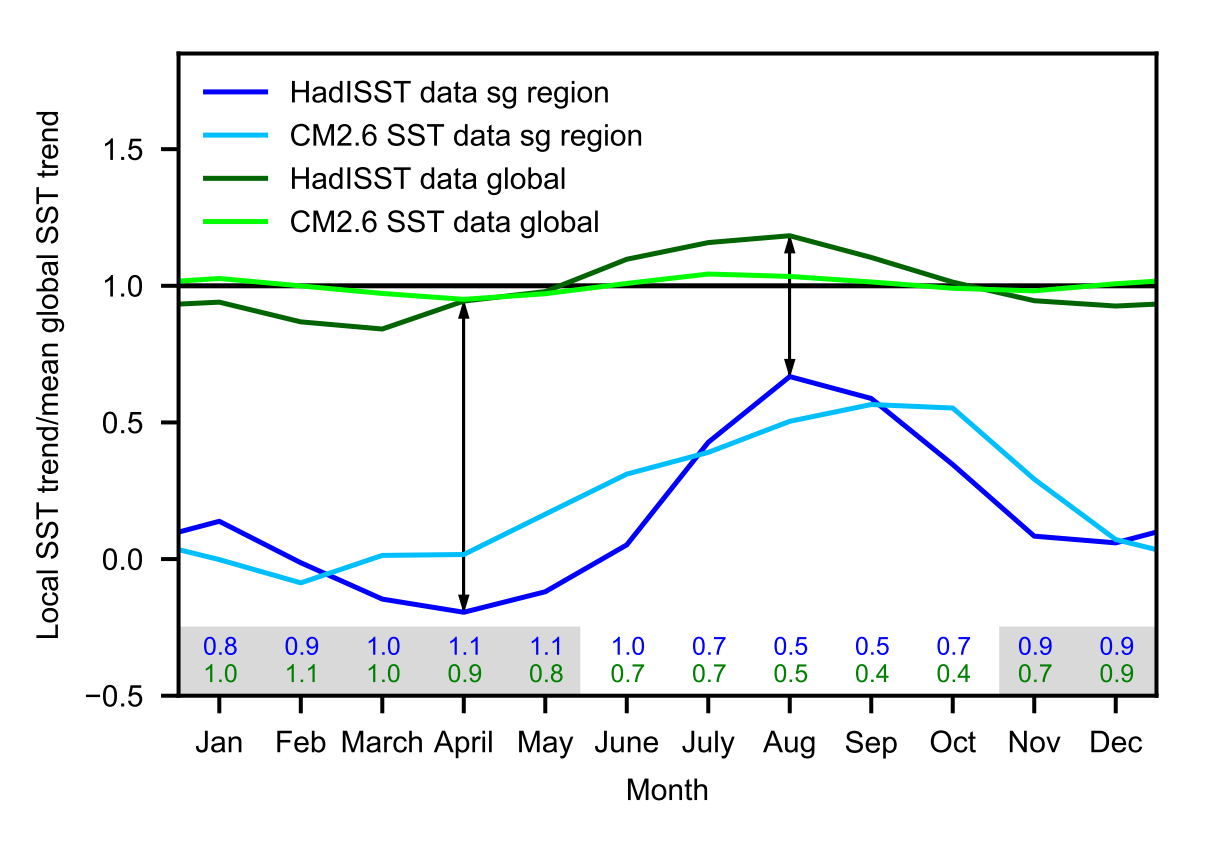
Fig.4: Shown are the annual cycles (i.e. the monthly-mean values) of the linear SST trend in the subpolar gyre region and for the whole globe (i.e. global-mean) for the CM2.6 model and the HadISST data, divided by the annual-mean, global-mean linear SST trend. Use the CM2.6_2xCO2_SST_*_GLOBAL_121_200_slope and HadISST_sst_*_slope data sets.
Figure 5
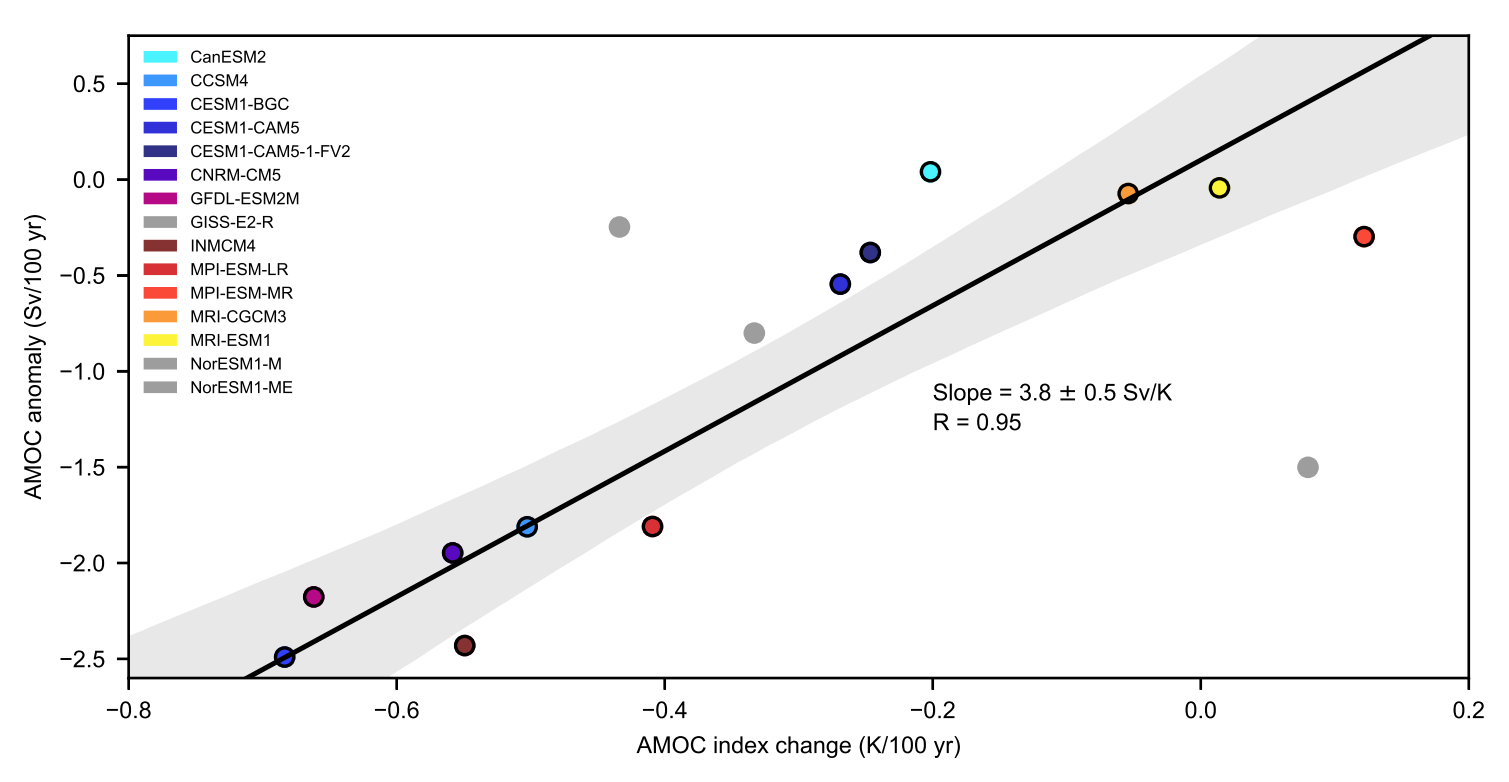
Fig.5.: Shown is the regression between the linear AMOC index trend and the linear AMOC strength trend in the analyzed CMIP5 models (Regression.xlxs).
Figure 6
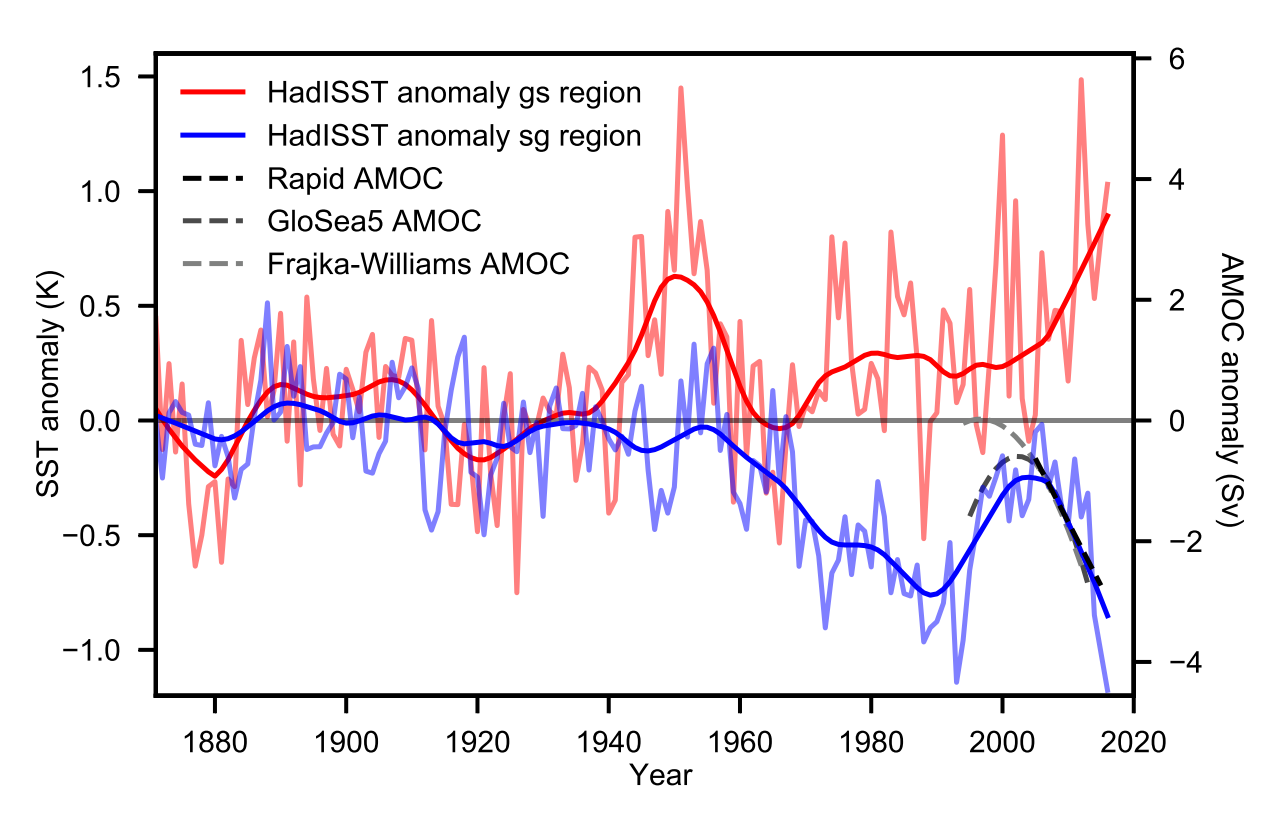
Fig.6: Shown are the time series of the SST anomaly in the subpolar gyre region (sg_index_hadisst.txt), the SST anomaly in the Gulfstream region (gulfstream_index_hadisst.txt) and the AMOC time series of the RAPID project (1), the GloSea5 reconstruction (2) the and reconstruction form Frajka-Williams (3).
-
Robson, J., Hodson, D., Hawkins, E. & Sutton, R. Atlantic overturning in decline? Nature Geoscience 7, 2-3, doi:10.1038/ngeo2050 (2014).
-
Jackson, L. C., Peterson, K. A., Roberts, C. D. & Wood, R. A. Recent slowing of Atlantic overturning circulation as a recovery from earlier strengthening. Nature Geoscience 9, 518-522, doi:10.1038/ngeo2715 (2016).
-
Frajka-Williams, E. Estimating the Atlantic overturning at 26°N using satellite altimetry and cable measurements. Geophysical Research Letters 42, 3458-3464, doi:10.1002/2015gl063220 (2015).
Web page created by L. Caesar