Potsdam Institute for Climate Impact Research (PIK), Telegrafenberg, P.O. Box 60 12 03, 14412 Potsdam, Germany.
The Climate Change Problem is very fashionable today. A huge amount of publications mask some simple facts that we can hardly conceive:
Svirezhev (1994) formulated a concept of "virtual biospheres". According to this concept the contemporary Earth biosphere is one of many possible (virtual) biospheres corresponding to different equilibria of a nonlinear dynamical "climate + biosphere" system. In the course of the planetary history and own evolution, this system passed through several bifurcation points in which some random factors (small perturbations) determined solution branches actually followed by the system. A driving force in this evolution could be the evolution of the "Earth green cover", which had, in turn, several bifurcation points, for instance, the appearance of terrestrial vegetation, or the change from the coniferous forest to the deciduous forest. Note that this concept contradicts Vernadsky's "ergodicity axiom", according to which the contemporary Earth biosphere is unique, irrespective of the initial and previous states.
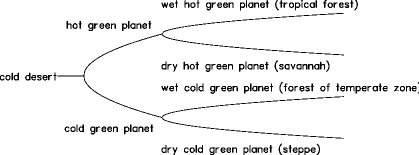
What kind of bifurcations are admissible in this system? We can observe a change of planet's "status" from a "cold desert" to either a "cold green planet", or a "hot green planet" (the first bifurcation). Then either a "wet hot" planet covered with a tropical rain forest, or a "dry hot" planet (savannah) develops from a "green hot" planet as a result of the second bifurcation. Analogically, either a "wet cold" (a temperate forest) or a "dry cold" (steppe) planet arises from a "green cold" planet (see Fig. 1).
Fig. 1: Bifurcation diagram for the "climate+biosphere" system.
A so-called minimal model describing the climate biosphere mechanisms of a hypothetical zero-dimensional point planet is described in (Svirezhev and von Bloh, 1996). Unlike other attempts of modelling the global vegetation (e.g., the Osnabrück biosphere model (Esser, 1991) or the Frankfurt biosphere model (Lüdeke et al., 1995)) the system can be fully understood through analytical as well as numerical inspections. This model consists of two coupled differential equations and is based on two hypotheses:
Hypothesis 1:
The albedo A depends only on the vegetation density N, so that A=A(N) is a monotonous decreasing function of N.
and
Hypothesis 2:
The growth function depends only on temperature T; it is an unimodular function of T.
Analytical calculations for this coupled climate-biosphere system indicate that up to two different stable equilibria are possible (the "dead" planet without any vegetation and the living planet, see Fig. 2).
Fig. 2: Zeros of the two differential equations (I) and (II) in the climate-vegetation domain {T,N} for different insolations. The intersections of the two curves indicate stationary points and are marked with a-c.
Further on a carbon cycle was added to the system of two differential equations (Svirezhev and von Bloh, 1997) increasing the number of equations to three. Because the total amount of carbon A is conserved the set of equations can be reduced by one. Two bifurcation parameters can be identified, A and the maximum biological productivity Pmax. Depending on these two parameters the "living" planet bifurcates into the "hot green" planet and the "cold green" planet. Fig. 3 shows the phase portrait in the climate vegetation domain.
Fig. 3: Phase portrait of the climate-biosphere system with carbon cycle. The different colors indicate the basins of attraction of the three stable equilibria "cold desert", "cold green planet", and "hot green planet".
Let us consider the evolution of the system topology when the total amount of carbon slowly decreases. An animation is available as a MPEG video(3 MByte).Fig. 4 plots the temperatures of the different equilibria as a function of A, where the black lines indicate trajectories of the evolution for either decreasing or increasing carbon. The color-shaded areas are the so-called basins of attraction, i.e. the set of initial conditions, starting in which trajectories come to the same stable equilibrium. The area denoted as the "cold desert" is the solution without vegetation on the planet. The equilibrium temperature is below the lower tolerable temperature, while the "hot desert" marks a solution with a temperature, which is too hot for the vegetation. The "hot green planet" and "cold green planet" are the non-trivial solutions with low and high vegetation densities, respectively.
Fig. 4: Bifurcation diagram of the "climate + biosphere" system. Black lines indicate trajectories of the evolution for either decreasing or increasing carbon. Color-shaded areas denote the basis of attraction of the stable equilibria.
Two hysteresis loops can be identified. Starting with the "hot desert" the planet evolves in the following way: hot desert → hot green planet -> cold green planet -> cold desert. The transition "hot green planet -> cold green planet" is accompanied by almost an explosive increase in vegetation biomass. Starting from the cold desert, however, a different path is realized: cold desert -> hot green planet -> hot desert. This means that a current state of the coupled climate-biosphere system depends on its history. The change from one to another equilibrium is done in a non-continuous way. The arrows in the diagram indicate non-continuous transitions. The rise of the hot green planet from the hot desert only is a continuous process.
This research is part of the POEM core project at the Potsdam Institute for Climate Impact Research.
COEM project
Werner von Bloh ( ) - 09 Oct 2002