 All
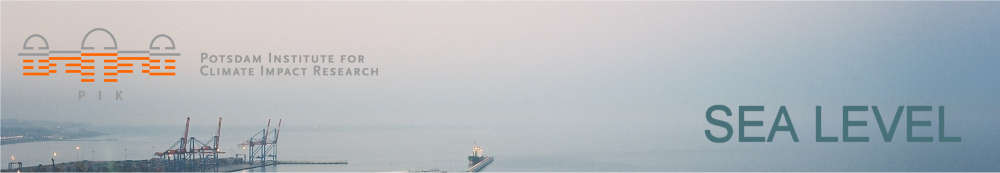
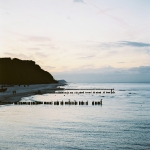
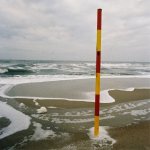
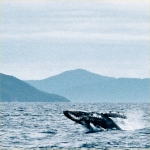
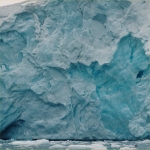
fotos © S. Rahmstorf All
fotos © S. Rahmstorf |
Animations Simulation of Larsen B ice shelf retreat as response to Larsen A collapse
The "eigencalving law" reveals far-reaching interactions between neighboring ice shelves that are mechanically connected. The simulation with PISM-PIK shows that the calving front position of Larsen B Ice Shelf retreats immediately after the disintegration of Larsen A ice shelf. A changing boundary affects the overall stress balance and the strain-rate field and hence the estimated calving rates at the ice shelf front. This mechanism provides an explanation for the gradual retreat of Larsen B Ice Shelf prior to its observed collapse in 2002. Greenish colors indicate ice speed anomaly (meter per year) with respect to the initial state of intact Larsen Ice Shelf system. Oberved front poistions of the years 1993, 1995 and 2000 are delineated in yellow, red and green respectively.Related Publication: Albrecht & Levermann (2014) . Simulation of ice shelf in Antarctica The extent of the floating ice shelves around Antarctica is mainly determined by the ice flow off the continent and the calving of ice bergs into the ocean. In these simulations with PISM-PIK we apply the "eigencalving law" saying that ice loss is proportional to the two-dimensional spreading of the ice. This formula is consistent with the observed stages of the ice fronts of Larsen A and B, as seen in the animation. (Light grey: land, dark grey: ocean, colours: ice shelf.). Related publication: A. Levermann et al. (2012). Ice flow in the PISM-PIK Antarctic Ice Sheet model
Visualisation of ice flow in the Antarctic ice sheet model PISM-PIK. The white dots show how particles move with the ice which are initially randomly distributed over the ice surface. Colours in addition show the flow speed. Related publications: Winkelmann et al. (2010), Martin et al. (2010). Glacial cycles simulated with a climate - ice sheet model A view of the continental ice sheet changes over the past 400,000 years, simulated with PIK's CLIMBER-2 model. The model is driven by orbital parameters and CO2 variations from Antarctic ice core data. The time in years before present is shown in the lower right corner. The changes in continental ice cover cause sea level changes with an amplitude of ~ 120 meters. Related publication: Ganopolski et al. 2010. Heinrich events simulated with an ice sheet model
A view of the Laurentide ice sheet over North America with steady climate forcing. The ice sheet builds up by snowfall but episodically loses ice by sliding, an internal dynamic instability. This mechanism may explain the so-called Heinrich events, which are episodic, massive ice discharges during glacial times. They are associated with up to 10 meters of sea-level rise and documented in deep-sea sediments across the Atlantic. Related publication: Calov et al. 2010.
|
Publications Images Animations Data & Code |
| © PIK |