City module - Urban livelihood vulnerability under rapid coastal city growth
A wave of unprecedented urbanization in human history is underway in a coastal band in non-OECD countries (UNDESA, 2006). Whether in Port-au-Prince in Haiti or Shanghai in China, emerging problems are compounding with unsolved long-standing ones to create a herculean management challenge for numerous coastal cities (Tanner et al, 2009). This challenge comprises different aspects of global change, such as climate change, urban sprawl, and urbanization on the one hand, and settlement distribution and natural hazards such as tropical cyclones, floods and landslides on the other. Combinations of these aspects generate vulnerability for urban livelihoods through a multitude of mechanisms, threatening both human well-being and ecosystems.
Based on similarities, we present a global categorization of these mechanisms into six typical, generalized manifestations and group the areas and coastal cities they are prevalent in. By doing so, we can identify coastal cities that share similar properties and challenges with respect to socio-ecological challenges under unprecedentedly rapid growth. A similar approach has been applied to drylands by Sietz et al (2011) to drylands.
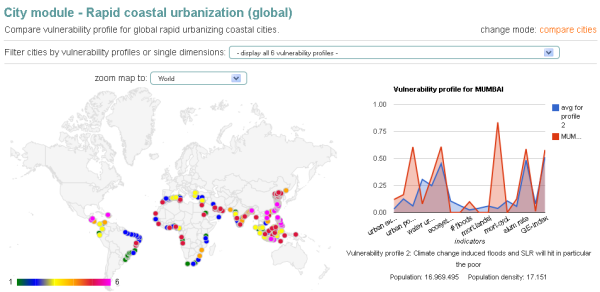
Figure 1. Module for displaying of spatial distribution and vulnerability profiles. Left: Map of six groups of cities under rapid coastal urbanization. Right: Example of a city vulnerability profile (Mumbai) and the average profile of the group it belongs to.
Important messages of the study
The two poorest groups (pink and orange) are most vulnerable to natural hazards. At the same time they comprise some of the World's most rapidly growing populations with the poorest coping capacities. City examples include Dacca, Maputo, Port-au-Prince, Manila, and Fuzhou.
The wealthiest group, showing a high percentage of people living in low-lying areas (dark blue) presents damages due to flood exposure and sensitivity do not act as an an 'early warning' for the much larger damages to be expected under climate change: Here the flood sensitivity is high despite low exposure, the highest management effectiveness and income, showing that capacity to adapt does not mean adapting. City examples include including Mumbai, Belém, and Cape Town.
Similar natural hazard damages are observable under contrasting exposures and abilities to adapt. This implies that there is much to learn from disadvantaged cities that are efficiently translating their limited means into reducing vulnerability. This study can help identify these "poster cities" and similar cities their efficacy may be transferrable to.
Interpretation aid and possible limitations
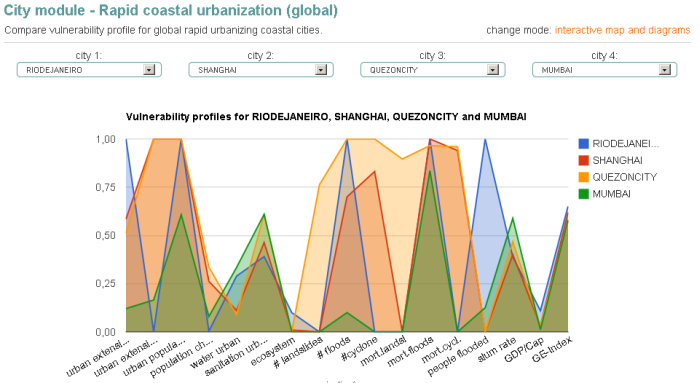
Each group has a typical combination of indicator values that is displayed in a profile under the map. These profiles are averages of all cities contained in them. Their spatial distribution is shown on the map, and each city on this map can be selected and displayed a) in a separate, city specific profile either together with its group profile (Fig. 1), or alongside two other cities of choice to aid comparisons (Fig. 2).
Figure 2: Module for comparing up to three cities under rapid coastal urbanization with respect to their vulnerability profiles.
What are assumptions and other reasons that limit the use of the results?
This study relies on globally available subnational and national gridded datasets of a 0.5° lon x 0.5° lat spatial resolution. While it allows for a global overview and comparing between cities with respect to the indicators used, the data does not, and cannot, replace in-depth case studies. This point is particularly the case when looking into the indicators that are only available on a national basis (see Table 1).
How was the data prepared/analysis performed?
After using case studies to identify typical vulnerability generating mechanisms, we formalized and indicated their most relevant elehnents with 17 globally available indicators (see Table 1 for examples). They include, inter alia, exposures and sensitivities to climate related extreme events, sea-level rise, marginalization, urban population growth, urban sprawl, management capacity, and prevalence of wetland ecosystems. The indicator datasets were fed into an established cluster analysis, revealing a typology of six clearly distinguishable mechanisms with typical combinations of indicator values.
Table 1. Quantification of vulnerability creating mechanisms: Identified indicators and subnational proxy datasets to represent them. Indicators addressing the state of the environment are predominantly from 2000. Indicators addressing change are predominantly from the time interval from 1990 to 2000.
Indicator
Dataset
Relative urban population change
Urban population change from 1990 - 2000 in percent of 1990 (Klein Goldewijk et al, 2009)
Total urban population
Total urban population in 2000 (Klein Goldewijk et al, 2010)
Total urban area per grid cell
Total urban area per grid cell in 2000 (Klein Goldewijk et al, 2010)
Urban population in poverty
Slum population in 2000 in percent of urban population (UN-HABITAT, 2008)
Cyclone sensitivity
Average relative mortality rate from cyclones (Dilley et al, 2005), aggregated to 0.5° resolution
Flood sensitivity
Average relative mortality rate from floods (Dilley et al, 2005), aggregated to 0.5° resolution
Landslide sensitivity
Average relative mortality rate from landslides (Dilley et al, 2005), aggregated to 0.5° resolution
Prevalence of surrounding wetlands
Combination of prevalence of key wetlands, and percentage to which wetlands immediately surround urban areas (Lehner and Döll, 2004, and CIESIN, 2005)
Urban area change rate
Urbanized area change per grid cell from 1990 - 2000 in percent of 1990 (Klein Goldewijk et al, 2009)
Relative change of access to adequate water facilities
Change of urban population with access to improved drinking water from 1990 - 2000 in percent of 1990
Relative change of access to adequate sanitation facilities
Change of urban population with access to sanitation facilities from 1990 - 2000 in percent of 1990
Cyclone exposure
Average relative frequency and distribution of cyclones (Dilley et al, 2005), aggregated to 0.5° resolution
Flood exposure
Average relative frequency and distribution of floods (Dilley et al, 2005), aggregated to 0.5° resolution
Landslide exposure
Average relative frequency and distribution of landslides (Dilley et al, 2005), aggregated to 0.5° resolution
Urban population percentage in low-lying areas
Combination of urban population percentage currently living 1m above sea level and below (Hastings et al, 1999, global DEM), and urban population data (Klein Goldewijk et al, 2009)
Per capita income
Per capita GDP (UNSTAT 2005; World Bank 2006)
Government effectiveness
Government effectiveness, aggregate and individual governance indicators (Kaufmann et al, the World Bank, 2009)
References
Sietz D, Lüdeke MKB, Walther C (2011) Categorisation of typical vulnerability patterns in global drylands. Global Environmental Change 21:431-440.
Tanner T, Mitchell T, Polack E, Guenther B (2009) Assessing Climate Change Resilience in Ten Asian Cities. Brighton.
UNDESA (2006) World Urbanization Prospects: the 2005 Revision, United Nations Population, Division Department of Economic and Social Affairs, New York.